Download
1 / 21
210 likes | 391 Views
Iso surface similarity maps. Stefen Bruckner and Torsten Moller Presenter Zahra Sahaf. Present structural information of a volume data set by depicting similarities between individual isosurfaces quantified by a robust information theoric measure

E N D
Isosurface similarity maps Stefen Bruckner andTorsten Moller Presenter Zahra Sahaf
Present structural information of a volume data set by depicting similarities between individual isosurfacesquantified by a robust information theoric measure • Automatic parameter free methodfor identifying representative iso values • Useful addition to conventional classification techniques Goal
One of the most common representations They visualize the data set by depicting the number of voxels for each data value. Histogram based methods typically infer similarity from the frequency at which isovalues occur. Related Works Histogram
Contour tree : encode nesting relationships of iso-contours Volume skeleton tree: identify iso surface embeddings Hyper reef graphs : capture the topological skeleton of a volumetric data set Related Works Topological Analysis
Contour tree : encode nesting relationships of iso-contours Volume skeleton tree: identify iso surface embeddings Hyper reef graphs : capture the topological skeleton of a volumetric data set Related Works Topological Analysis
Contour tree : encode nesting relationships of iso-contours Volume skeleton tree: identify iso surface embeddings Hyper reef graphs : capture the topological skeleton of a volumetric data set Related Works Topological Analysis
Collection of local properties such as first and second derivatives • Plotting these attributes against isovalues provides guidance for feature selection Related Works Derivatives
Related Works Dimensional Reduction Relationships
Previous methods attempt to characterize volume data sets by analyzing global isosurface statistics, extracting topological relationships, or collecting local voxel signatures. • The proposed approach is fundamentally different in that it measures similarities of isosurfaces as a whole based on a robust information-theoretic measure. Related Works Shortage
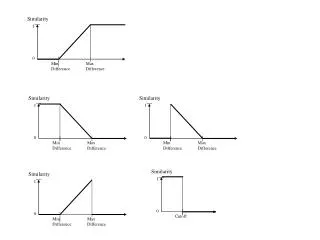
Mutual information quantifies the amount of information that X and Y share by measuring how much knowing one of these variables reduces the uncertainty about the other Entropy quantifies the uncertainty associated with a random variable Similarity Measure
Distance transform • Volume data frequently contains material inhomogeneity, partial volume effects, and noise. • Represent individual iso surfaces using their distance transform. The distance transform Dhof an iso surface with iso value h gives the minimum distance of a point x to the surface: Similarity Measure…
Regard distance from any point to a pair of iso surfaces Lpand Lqas random variables X and Y Mutual information between the two surfaces = joint distributionof X and Y Joint histogramof Dpand Dq Marginal probability distributionof X and Ycan be estimated by summing over the columns and rows of the joint histogram. (H(X,Y), H(X) , H(Y)) Similarity Measure…
Discrete set of N iso values N*N matrix containing iso surface similarity values, for each combination of iso values hiand hj Iso surface similarity distribution Similarity Map
Original image Original image with noise Histogram Similarity map Example Similarity distribution
Problem: Even minor changes in the selected iso values can have dramatic impact on the depicted feature Solution: Indicate the stability of an iso surface by visually encoding the similarity of a sample point with respect to a specified iso value Importance function Opacity function Application Application Similarity Enhanced Iso surface Visualization
Problem: Mapping between user interface and isovalue is typically linear: • Examples are slider widgets, mouse movement, etc. • Data-dependent nonlinear visual response to user interaction • Makes it more difficult to investigate transitional value ranges Solution: Control derivative of the mapping function using the similarity between neighboring isovalues Linear mapping Similarity based mapping Application Similarity Enhanced IsoSurface Remapping
Problem: Find “good” isovalues for a given data set without requiring parameter tuning • Representative: Each isovalues exhibits high similarity to many other isovalues • Distinct: The individual chosen isovalues have low mutual similarity Solution: Reorder all isovalues according to these criteria by recursively evaluating the similarity distribution Application Representative isovalue Selection
Advantage • Providing a concise overview of data set • In contrast to histogram, large regions do not tend to dominate depiction • Due to the choice of mutual information as a similarity measure, uncorrelated noise has little influence • Improve visualization and analysis of volume data Disadvantage • Considerable cost of generating the iso surface similarity map • Brute force approach for generation method Cons & Pros
Volume quantization and compression • Volume segmentation • Multi dimensional classification Future Directions