Download
1 / 46
490 likes | 692 Views
From Sentiment to Emotion Analysis in Social Networks. Jie Tang Department of Computer Science and Technology Tsinghua University, China. Social Networks. > 1000 million users The 3 rd largest “Country” in the world More visitors than Google. > 800 million users.

E N D
From Sentiment to Emotion Analysis in Social Networks Jie Tang Department of Computer Science and Technology Tsinghua University, China
Social Networks • >1000 millionusers • The 3rd largest “Country” in the world • More visitors than Google • >800 millionusers • 2013, users, 40% yearly increase 560 million • 2009, 2 billiontweets per quarter • 2010, 4 billiontweets per quarter • 2011, tweets per quarter 25 billion • More than 6billion images • Pinterest, with a traffic higher than Twitter and Google
A Trillion Dollar Opportunity Social networks already become a bridge to connect our daily physical life and the virtual web space On2Off [1] [1] Online to Offline is trillion dollar business http://techcrunch.com/2010/08/07/why-online2offline-commerce-is-a-trillion-dollar-opportunity/
Core Research in Social Network Application Prediction Search Information Diffusion Advertise Macro Meso Micro Social Network Analysis BA model ER model Community Group behavior Dunbar Social tie Action Social influence Theory Social Theories Algorithmic Foundations BIG Social Data
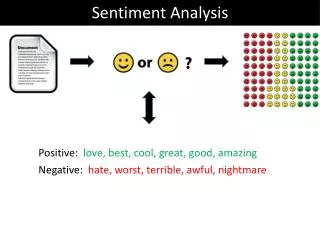
“Love Obama” I hate Obama, the worst president ever I love Obama Obama is fantastic Obama is great! No Obama in 2012! He cannot be the next president! Positive Negative
Homophily and Influence • Homophily—“birds of a feather flock together” • A user in the social network tends to be similar to their connected neighbors. • Originated from different mechanisms • Influence • Indicates people tend to follow the behaviors of their friends • Selection • Indicates people tend to create relationships with other people who are already similar to them • Confounding variables • Other unknown variables exist, which may cause friends to behave similarly with one another.
Twitter Data An example: “#lakers b**tch!” =? √ X • Twitter • 1,414,340 users and 480,435,500 tweets • 274,644,047 t-follow edges and 58,387,964 @ edges • Manually labeled thousands of users [1] ChenhaoTan, Lillian Lee, Jie Tang, Long Jiang, Ming Zhou, and Ping Li. User-level sentiment analysis incorporating social networks. In KDD’11, pages 1397–1405, 2011.
Influence Shared sentiment conditioned on type of connection.
Selection Connectedness conditioned on labels
Sentiment vs. Emotion Charles Darwin: • Emotion serves as a purpose for humans in aiding their survival during the evolution.[1] Emotion is the driving force of user’s sentiments… Emotion stimulates the mind 3000 times quicker than rational thought! [1] Charles Darwin.The Expression of Emotions in Man and Animals. John Murray, 1872.
“Happy” System SMS & Calling Location Activities Emotion Can we predict users’ emotion?
Observations (cont.) Dorm The Old Summer Palace ? ? ? ? GYM Activity correlation Classroom ? Location correlation (Red-happy) Karaoke
Observations (a) Implicit groups by emotions (a) Social correlation (c) Calling (SMS) correlation
Observations (cont.) Temporal correlation
MoodCast: Dynamic Continuous Factor Graph Model Our solution 1. We directly define continuous feature function; 2. Use Metropolis-Hasting algorithm to learn the factor graph model. • [1] Jie Tang, Yuan Zhang, Jimeng Sun, JinghaiRao, Wenjing Yu, Yiran Chen, and ACM Fong. Quantitative Study of Individual Emotional States in Social Networks. IEEE TAC, 2012, Volume 3, Issue 2, Pages 132-144.
Problem Formulation Gt =(V, Et, Xt, Yt) Time t Emotion: Sad Time t-1, t-2… Attributes: - Location: Lab - Activity: Working Learning Task:
Dynamic Continuous Factor Graph Model Time t’ Time t : Binary function
Learning with Factor Graphs y5 y4 y3 y'3 y1 y2 Attribute Social Temporal
MH-based Learning algorithm Random Sampling Update • [1] Yuan Zhang, Jie Tang, Jimeng Sun, Yiran Chen, and JinghaiRao. MoodCast: Emotion Prediction via Dynamic Continuous Factor Graph Model. In ICDM’10. pp. 1193-1198.
Still Challenges • Q1: Are there any other social factor that may affect the prediction results? • Q2: How to scale up the model to large networks?
Q1: Conformity Influence Positive Negative I love Obama 3. Group conformity Obama is fantastic Obama is great! 1. Peer influence 2. Individual [1] Jie Tang, Sen Wu, and Jimeng Sun. Confluence: Conformity Influence in Large Social Networks. In KDD’13, 2013.
Conformity Factors • Individual conformity • Peer conformity • Group conformity A specific action performed by user v at time t All actions by user v
Q2: Distributed Learning Master Global update Slave Compute local gradient via random sampling Graph Partition by Metis Master-Slave Computing Inevitable loss of correlation factors!
Random Factor Graphs Master: Optimize with Gradient Descent Slave: Distributedly compute Gradient via LBP Gradients Parameters K=1 K=2 Continue to increase K Master-Slave Computing
Model Inference • Calculate marginal probability in each subgraph • Aggregate the marginal probability and normalize
Theoretical Analysis • Θ*: Optional parameter of the complete graph • Θ: Optional parameter of the subgraphs • Ps,j: True marginal distributions on the complete graph • G*s,j: True marginal distributions on subgraphs • Let Es,j = logG*s,j– logPs,j,we have:
Results for Sentiment Analysis • Twitter • 1,414,340 users and 480,435,500 tweets • 274,644,047 t-followedges and 58,387,964 @ edges • Baseline • SVM Vote • Measures • Accuracy and Macro F1
Results for Emotion Analysis • Data Set • Baseline • SVM • SVM with network features • Naïve Bayes • Naïve Bayes with network features • Evaluation Measure: Precision, Recall, F1-Measure
Factor Contributions • All factors are important for predicting user emotions Mobile
Framework: Images -Aesthetic Effects -Emotions • Model: Factor Graphs for images in Social Networks • [1] JiaJia, Sen Wu, Xiaohui Wang, Peiyun Hu, LianhongCai, and Jie Tang. Can We Understand van Gogh’s Mood? Learning to Infer Affects from Images in Social Networks. In ACM Multimedia. pp. 857-860. • [2 ] Grand Challenge 2nd Prize Award
App1: Emotion Distribution on Flickr VS During Thanksgiving holiday Before Thanksgiving 2011 100,000 Images from Flickr Happy, Cheerful, and Peaceful
App2: Modify Images with Emotional Words Summer? Happy More than 180 different effects Autumn? Natural Original Image Winter? Clear
Summary • Social networks bring revolutionary changes to the Web and unprecedented opportunities for us • Emotion stimulates minds 3000 times faster than rational thoughts! • Embedding social theories into sentiment/emotion analysis can benefit many applications
Related Publications • Jie Tang, Jimeng Sun, Chi Wang, and Zi Yang. Social Influence Analysis in Large-scale Networks. In KDD'09, pages 807-816, 2009. • ChenhaoTan, Lillian Lee, Jie Tang, Long Jiang, Ming Zhou, and Ping Li. User-level sentiment analysis incorporating social networks. In KDD’11, pages 1397–1405, 2011. • Jie Tang, Sen Wu, and Jimeng Sun. Confluence: Conformity Influence in Large Social Networks. In KDD’13. • Jie Tang, Yuan Zhang, Jimeng Sun, JinghaiRao, Wenjing Yu, Yiran Chen, and ACM Fong. Quantitative Study of Individual Emotional States in Social Networks. IEEE Transactions on Affective Computing (TAC), 2012, Volume 3, Issue 2, Pages 132-144. (Selected as the Spotlight Paper) • Yuan Zhang, Jie Tang, Jimeng Sun, Yiran Chen, and JinghaiRao. MoodCast: Emotion Prediction via Dynamic Continuous Factor Graph Model. In ICDM’10. pp. 1193-1198. • JiaJia, SenWu, XiaohuiWang, PeiyunHu, LianhongCai, and Jie Tang. Can We Understand van Gogh’s Mood? Learning to Infer Affects from Images in Social Networks. In ACM MM, pages 857-860, 2012. • Xiaohui Wang, JiaJia, Peiyun Hu, Sen Wu, LianhongCai, and Jie Tang. Understanding the Emotional Impact of Images. (Grand Challenge)In ACM MM. pp. 1369-1370. (Grand Challenge 2nd Prize Award)
Thanks you! Collaborators:Lillian Lee, Chenhao Tan (Cornell) Ming Zhou, Long Jiang (Microsoft), Yuan Zhang (MIT) Jimeng Sun (IBM), JinghaiRao (Nokia) Sen Wu, JiaJia, Xiaohui Wang, Yiran Chen, WenjingYu (THU) • Jie Tang, KEG, Tsinghua U, http://keg.cs.tsinghua.edu.cn/jietang • Download data & Codes,http://arnetminer.org/download