Download
1 / 9
90 likes | 206 Views
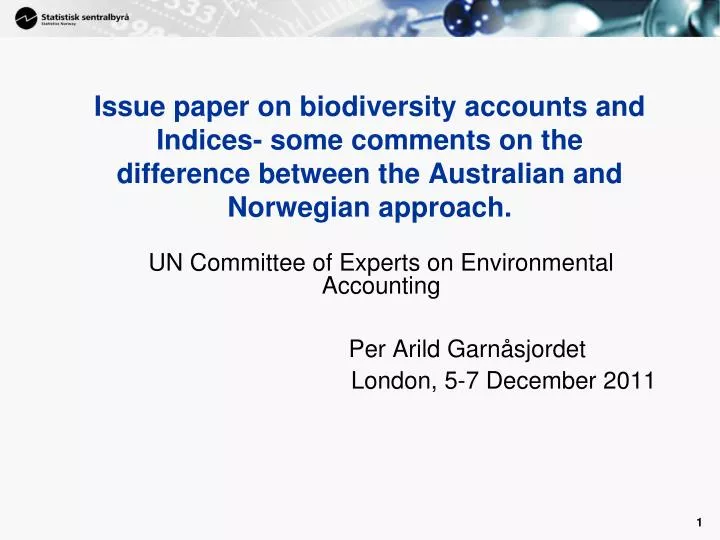
Issue paper on biodiversity accounts and Indices- some comments on the difference between the Australian and Norwegian approach. UN Committee of Experts on Environmental Accounting Per Arild Garnåsjordet London, 5-7 December 2011.

E N D
Issue paper on biodiversity accounts and Indices- some comments on the difference between the Australian and Norwegian approach. UN Committee of Experts on Environmental Accounting Per Arild Garnåsjordet London, 5-7 December 2011
Purpose: Overview of state and trends of biodiversity • Measure state and trends of biodiversity in natural ecosystems, including the cultural landscape. • Reflect threats to biodiversity: The combined effect of all pressure. • Combines current biodiversity knowledge in a common conceptual framework (expert-judgements and monitoring data). • Measurement tool for government policy and management www.dirnat.no
5 national research institutesStatistics Norway125 ResearchersInternet based data-collection1950, 1990, 2000, 2010, 2020309 indicators S = State W= Weighted at trophical level t= time i= species j= ecosystem k= municipality, area
Several scaling models: several way of using the reference condition. Reference state ist the ”ideal’ state for the ecosystem. Model decided by each expert.
Coastal Waters Terrestrial Ecosystems Open ocean Freshwater Fish index Fish Fish Fish Mammal index Mammals Mammals Mammals Mammals Amphibians Amphibian index Bird index Birds Birds Birds Birds Invertebrates Invertebrates Invertebrates Invertebrates Invertebrate index Plants Plant index Plants Plants Plants Plants Nature Index Nature index
% change from1990 to 2010 % change, whole country www.dirnat.no
State of biodiversity: Norway and Netherlands Ut til 1 nautisk mil AREAL Ut til 12 nautisk mil AREAL www.dirnat.no
Some differences between the Australian and Norwegian approach. Administrative units- ecosystem within these units Trophic levels- All levels equally represented Max,min and optimal levels Scaleable from local to regional to national level, thematic indices. Systematic use of expert judgements Systematic information about uncertainty in estimates ( 25 and 75 percentiles) Marine areas included THE INDICATORS WILL CHANGE WHEN USED FOR POLICY