Download
1 / 16
160 likes | 279 Views
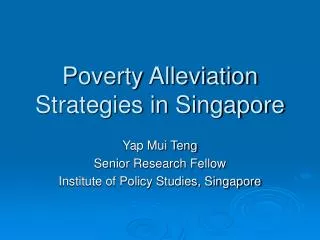
Strategies to Alleviate Poverty in Andean Countries. Taking Action for the World's Poorest and Hungry. Maximo Torero m.torero@cgiar.org 17-19 October 2007, Beijing, China. PER. 600. .7. .6. 400. .5. Per capita expenditure / income (1993 PPP US$). 200. .4. .3. 0. 1970. 1980. 1990.

E N D
Strategies to Alleviate Poverty in Andean Countries Taking Action for the World's Poorest and Hungry Maximo Torero m.torero@cgiar.org 17-19 October 2007, Beijing, China
PER 600 .7 .6 400 .5 Per capita expenditure / income (1993 PPP US$) 200 .4 .3 0 1970 1980 1990 2000 2010 year Per capita expenditure / income (1993 PPP US$) Gini coefficient Source: POVCAL, based on household surveys
Income and inequality in Latin America (selected countries) ARG BOL BRA CHL COL .7 600 .6 400 .5 200 .4 .3 0 CRI DOM ECU GTM HND .7 600 .6 400 .5 200 .4 .3 0 JAM MEX NIC PAN PER Gini coefficient Per capita expenditure / income (1993 PPP US$) .7 600 .6 400 .5 200 .4 .3 0 1970 1980 1990 2000 2010 PRY SLV URY VEN .7 600 .6 400 .5 200 .4 .3 0 1970 1980 1990 2000 2010 1970 1980 1990 2000 2010 1970 1980 1990 2000 2010 1970 1980 1990 2000 2010 year Per capita expenditure / income (1993 PPP US$) Gini coefficient Source: POVCAL, based on household surveys
An example of spatial concentration of the poorest in a adverse geographical area
Is there really no improvement? Sahn and Younger (2006) find evidence that despite increasing income inequality, non-income dimensions of well-being (child’s height and young women’s education) have improved in Latin America over the last 20 years. Sahn, David E., and Stephen D. Younger (2006). “Changes in inequality and poverty in Latin America: Looking beyond income to health and education”, Journal of Applied Economics, 9 (2): 215-233.
What are the possible types of Assets over which interventions can take place?
Summary findings on conditional cash transfer programs • Overall consensus that these programs have been mostly successful in achieving their core objectives. • There exists some evidence in favor of the cost-effectiveness of CCTs compared to supply-side programs • Exclusive focus of CCTs on human capital accumulation misses the broader context of poverty alleviation programs within rural development, crowding out programs oriented to productive activities, • By targeting children of school age and leaving out infants, CCTs have less horizontal efficiency than other programs.
Summary findings on microfinance and titling interventions With respect to Microfinance • Evidence suggests that they are mostly ineffective in reaching the core poor, but might help reduce poverty by reaching the better-off poor or potential micro-entrepreneurs. • Consistent with the role of microfinance institutions as a vehicle for the development of the micro-enterprise sector in Latin America, rather than the role as a tool for the removal of core poverty in Asia.
Summary findings on microfinance and titling interventions With respect to titling and property rights • First channel - risk of expropriation: Some impact in Field 2005. • Second channel is gains from trade of land: Clear gain in value of the plot (Torero&Field; 2006 and Galiani et.al;2006). • Third channel is Collateral and Credit Markets: No impact. Titles is not enough, we need to look into information asymmetry and the supply side (Field and Torero; 2005 and Galiani et.al; 2006) • Provision of Public Goods at the level of the Neighborhood:No clear impact (Torero & Field; 2006)
Summary of Findings on labor market impacts of job training programs
Projoven: Training Quality and Monthly Earnings 1996-2003 Source: Chong, Alberto and Jose Galdo. Training Quality and Earnings: The Effects of Competition on the Provision of Public-Sponsored Training Programs. IZA 2006
Summary findings in terms of access to public services (infrastructure) • For rural telephones and electricity: best practices identified: • Universal access not universal service • Competitive funds to cross subsidy from high demand urban areas to areas with real access gap (ex: Chile and Peru) • Ultimate constraint is users’ willingness to pay at least as much as needed to keep the service going after initial installation and startup • Supply side: the primary concern is ensuring effective competition for the subsidies • Enabling environment: a clear, stable, and credible legal and regulatory sectoral and general business framework • For rural roads: • Not clear evidence on maintenance funds, most success stories are un urban areas • CREMAs: “Contratos de Recuperación y Mantenimiento” (Road rehabilitation and maintenance contracts) – PPPs that prevent diverting the funds to other purposes.
Summary findings in terms of targeting strategies • Evidence from poverty maps in Ecuador, Perú, and Colombia shows the poor are geographically concentrated in the central Andean region, supporting geographic targeting. • Coady (2006) finds that geographic targeting dominates demographic and household proxy-means targeting in the case of PROGRESA in Mexico. • However, differences in implementation play a crucial role in the success of reaching the poor. • Evidence from Peru indicates that the choice of geographic targeting indicator might not have an important bearing on poverty outcomes (Schady (2002)). • Community-based decision makers may play a more important role in the degree of overall targeting of poor individuals than the central government’s choice of districts (Stifel and Alderman (2005)), • There is also evidence that demand-driven programs compare well with other programs in reaching the poor (Van Domelen (2002))
Final remarks • One size does not fit all, what works under one environment not necessarily will work in another, it will need to be adjusted • The optimal program could be an optimal mix of programs according to differentiated needs • Institutional and political economy environment matters