Download
1 / 22
220 likes | 316 Views
Deliberate Decisions About the 2012 Federal Budget. How the American Public Would Reduce Spending and Increase Taxes to Shrink the Budget Deficit. Curtiss Cobb, Norman Nie and Saar Gold 67 th Annual Conference of the American Association for Public Opinion Research (AAPOR)

E N D
Deliberate Decisions About the 2012 Federal Budget How the American Public Would Reduce Spending and Increase Taxes to Shrink the Budget Deficit Curtiss Cobb, Norman Nie and Saar Gold 67th Annual Conference of the American Association for Public Opinion Research (AAPOR) May 2012, Orlando, FL.
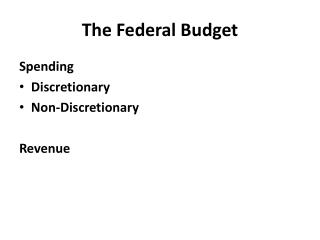
Outline The Budget Dilemma The Budget Exercise The Overall Solution The Details Conclusion 2
1. The Dilemma The American public is more concerned over the state of the economy and issues related to government spending than any other issues. 3
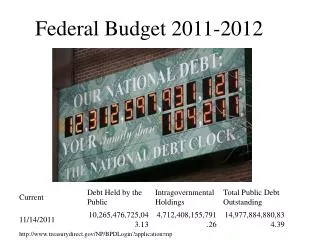
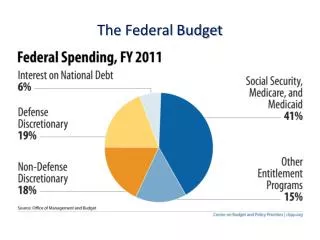
1. The Dilemma The 2012 Federal Budget projects: $2,628 billion in revenue -$3,729 billion in spending $1,101 billion deficit • Leaders in Washington DC are unable to reach a compromise to deal with the budget deficit. • Can the American public do what Congress and the President cannot? 4
Probability-based ABS recruitment Recruitment takes place throughout the year Representative of U.S. adults Includes: Adults with no Internet access (24% of adults) • KP provides laptop and free ISP Cell phone only (30% of adults) Spanish-language Extensive profile data maintained on each member • demographics, attitudes, behaviors, health, media usage, etc. Samples from the panel are assigned to projects • e-mail invitations and a link to the online survey questionnaire 55,000+ members 5
2. The Budget Exercise 1,778 interviews with U.S. general population adults Fielded from July 28 through August 9, 2011 Interactive Budget Exercise 28 area of federal spending presented in random order All 6 personal income tax brackets and the average corporate tax rate Randomized whether respondents received spending or taxes first Immediate feedback to respondents Allowed respondents to change responses as much as they wanted until they reached their preferred solution 6
1. The Budget Exercise Spending 7
2. The Budget Exercise Revenue 8
3. The Overall Solution *Spending and Revenue do not match total federal spending or revenue due to only asking respondents about a subset of programs and taxes. The “average” American wants… Results in a $27 billion surplus for 2012. 9
3. The Overall Solution 19% wants less than $1 trillion in spending. 3% want to increase spending. Distribution of Spending Solutions 10
3. The Overall Solution Without the slash and burn crowd, the “average” American wants to cut spending by 13% and increase revenue through taxes by 10%. That amounts to $3 in spending reductions for every $1 in new tax revenue. 11
3. The Overall Solution There are clear differences across the political spectrum, but every group’s total solution is within $100 billion of each other. 12
3. The Overall Solution Average Desired Tax Rate for High Earners and Corporations 13
3. The Overall Solution Cut by 1-10% Cut by10-15% Cut by more than 15% There is almost no taste for making major cuts to entitlement programs. Individual want to raise taxes on those that earn more than they do themselves and on corporations. 14
3. The Overall Solution The solution looks simple at this level, however…. The Devil is always in the details. 15
4. The Details Highest Agreement 7% Cut 7% Cut 5% Cut 5% Cut 11% Cut 11% Cut 13% Cut 13% Cut 13% Cut 20% Cut 13% Cut 20% Cut With few exceptions, agreement on spending is highest among categories the public wants to cut least (on average)… 16
4. The Details Lowest Agreement 56% Cut 5% Increase 30% Cut 13% Cut 23% Cut 1% Cut And lowest among categories the public most wants to cut. 17
4. The Details Moreover, there are 4 competing spending priorities, which makes reaching a compromise a multi-dimensional problem with no median vote 18
4. The Details Ranked spending priorities show differences along partisan lines W=Social Welfare; S=Security; F=The Future; I=Special Interest 19
4. The Details Ranked spending priorities show differences along age and race/ethnic lines. W=Social Welfare; S=Security; F=The Future; I=Special Interest 20
5. Conclusions The average solution is $3 in less spending for every $1 in new revenue. Differences in political views seem relatively modest. There is almost no taste for making major cuts to existing domestic entitlement programs. Moreover, there are 4 competing spending priorities, which makes reaching a compromise a multi-dimensional problem with no median vote. 21
Thank you!curtiss.cobb@gfk.com Curtiss L. Cobb III is Director of Survey Methodology at GfK. Norman H. Nie is Professor Emeritus of Political Science at the University of Chicago and Stanford University, and co-founder of Knowledge Networks, now a GfK company. Saar Golde is Data Solutions Architect at Revolution Analytics.