Download
1 / 23
230 likes | 348 Views
Analysis of Galaxies Using Sloan Digital Sky Survey. Kevin Cooke. Outline. Galaxy Characteristics and Importance Sloan Digital Sky Survey: What is it? IRAF: Uses and advantages/disadvantages Fits files?

E N D
Analysis of Galaxies Using Sloan Digital Sky Survey Kevin Cooke
Outline • Galaxy Characteristics and Importance • Sloan Digital Sky Survey: What is it? • IRAF: Uses and advantages/disadvantages • Fits files? • Question: Can we observe the red sequence from the cluster total redness? What are the observed features of SDSSJ1336?
Elliptical Galaxies M89Hubble Space Telescope
What should we expect? • Lack of cold dust in low redshift ellipticals • This manifests in low star formation. • Redness, defined here as the difference between blue and red, should increase with z. • Little to no ionization emission lines due to lack of ionizing radiation.
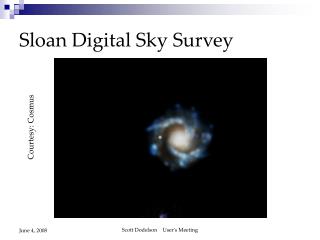
Sloan Digital Sky Survey • 8 year project from 4000-10000 A • 8400 square degrees covered • Includes over 930,000 Galaxies! • > 120,000 quasars • More than a quarter of the sky and capable of measuring redshift. • 3D Universe generation possible!
SDSS Equipment • Apache Point Observatory, Sunspot, NM • Maintained by New Mexico State University • Dedicated 2.5 m telescope. 120 megapixels • 5 filters • u - 3543 A • g - 4770 A • r - 6231 A • i - 7625 A • z - 9134 A
SDSS Results • Total of 3 surveys performed since 2000. • SDSS I 2000-2005 • SDSS II 2005-2008 • SDSS III 2008-2014 • The SDSS was funded by the Alfred P. Sloan Foundation, NSF, and the Department of Energy.
IRAF • Organized by the National Optical Astronomy Observatory (NOAO) • A collection of tasks using Unix architecture rather than one program. • No error or exception feedback, the impetus for PyRAF.
FITS Files • A fits file is an image storage file extension first developed in the 1980s. Support office available at NASA GSFC. • Stores data as a table of values in multiple ‘dimensions’ that can be called individually. • This allows for multiple wavelength files to be in one file together (Hopefully properly labeled)
Red Sequence • A measurement of the redness of the population of ellipticals in clusters. Done by Mike Gladders and H.K.C. Yee at the University of Toronto. • Can we observe the trend purely based on a photometrically derived redness for the entire cluster? • Could be a rough estimation device.
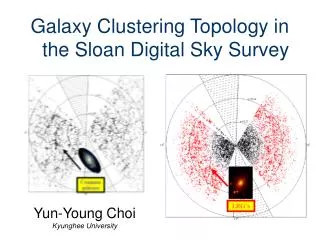
Clusters have differentiation of each galaxy type at each redshift. • Each color-color relation can be plotted alongside. • Important -Ellipticals do not overlap! Gladders, M., & Yee, H. (2000). A new method for galaxy cluster detection.
Color-Color Diagram • A redward trend is visible at low confidence. • Caveat: Total color, not individual color. • More data is needed.
Discrepancies • The modeled color-color plot of galaxy clusters was for a apparent magnitude of -22. • Projection effects from incorrect masking during photometry in the pipeline. • Filter wavelengths may not have the same coverage.
Possible Improvements • Attain data on constituents of cluster. • Test for layering of ellipticals, spirals, etc. • Develop alternative analytical methods. • IDL • QfitsView • Focus on a few important galaxies, or at least that have easily read data…
SDSSJ 1336 • Brightest Cluster Galaxy • Dominant elliptical at the center of a cluster. • Lensing? • Z = 0.1764 • This translates to 2.1 Gyr ago. • Redshift applies to all colors.
Conclusions • SDSSJ1336 has detectable OIII, Hβ • OIII/Hβ=0.46
Conclusions • SDSSJ1336 is a LINER Galaxy. • The Red Sequence may be visible with average color, however high margin for error. • Many display tools are available for data,and future work should focus on this possibilities.
In Thanks • SDSS Visual Spectra Interactive Display • IRAF • Gladders, M., & Yee, H. (2000). A New Method for Galaxy Cluster Detection.