Download
1 / 23
240 likes | 290 Views
Facility Layout. Objectives of Facility Layout Basic Types Service Process Layout Product Layout Product vs. Process Layouts Designing Process Layouts Designing Product Layouts Product Layouts & Line Balancing. Objectives of Facility Layout. Minimize material handling costs

E N D
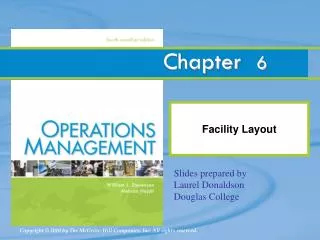
Facility Layout • Objectives of Facility Layout • Basic Types • Service Process Layout • Product Layout • Product vs. Process Layouts • Designing Process Layouts • Designing Product Layouts • Product Layouts & Line Balancing
Objectives of Facility Layout • Minimize material handling costs • Utilize space and labor efficiently • Eliminate bottlenecks • Facilitate communication • Reduce manuf. cycle time or customer service time • Promote product and service quality • & Many others
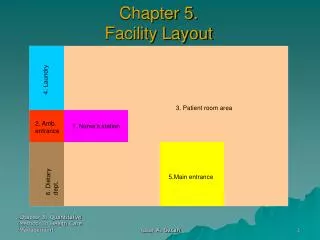
Basic Types of Layouts • Process Layout • machines grouped by process they perform • Product Layout • linear arrangement of workstations to produce a specific product • Fixed Position Layout • used in projects where the product cannot be moved
Hybrid Layouts • Cellular layouts • group machines into machining cells • Flexible manufacturing systems • automated machining & material handling systems • Mixed-model assembly lines • produce variety of models on one line
Manufacturing Process Layout Lathe Department Drilling Department Milling Department L L M M D D D D M M D D D D L L L L G G G P G G G P L L Painting Department Grinding Department L L A A A Receiving and Shipping Assembly
Shoes Housewares Women’s dresses Cosmetics & Jewelry Women’s sportswear Entry & display area Men’s department Service Process Layout Children’s department Power Tools
A Product Layout IN OUT
Product vs. Process Layouts PRODUCT LAYOUTPROCESS LAYOUT 1. Description Sequential arrangement Functional grouping of machines of machines/areas 2. Type of Continuous, mass Intermittent, job shop, Process production, assembly batch production 3. Product Standardized, make-to-stock Varied, make-to-order 4. Storage Small Large (IKEA?)
Designing Process Layouts • Minimize material handling costs • Block Diagramming • minimize nonadjacent loads • use when quantitative data is available • Relationship Diagramming • based on location preference between areas • use when quantitative data is not available
Block Diagramming • Examples page 350 & 365 • Create load summary chart • Calculate composite (2-way) movements(if necessary) • Develop trial layouts minimizing number of nonadjacent loads(i.e., this means min cost or distance) • Assume nonadjacent loads are 2x (expense or distance)
LOAD SUMMARY CHART($) DEPARTMENT DEPT. 1 2 3 4 5 1 100 110 2 200 150 50 3 40 50 4 60 5
Relationship Diagramming • Used when quantitative data is not available • Muther’s grid displays preferences • Denote location preferences with weighted lines
Ranking System For Departments A - absolutely necessary E - especially important I - important O - okay U - unimportant X - undesirable
Production O A Offices U I O Stockroom E A A X Shipping and Receiving U U U O O Locker Room O Toolroom Relationship Diagramming Example
Service Layouts • Usually process layouts • Minimize flow of customers or paperwork • Retailing tries to maximize customer exposure to products • Computer programs consider shelf space, demand, profitability • Layouts must be aesthetically pleasing
Designing Product Layouts (assembly lines) • Precedence diagram • network showing order of tasks and restrictions on their performance • Cycle time • maximum time product can spend at any one workstation; largest workstation time; how often a product is completed • Example on page 360 & 367
Product Layouts & Line Balancing 1. Draw and label a precedence diagram 2. Calculate desired cycle time 3. Calculate theoretical min # of workstations 4. Group elements into the minimum # of workstations recognizing cycle time and precedence constraints 5. Calculate efficiency of the line 6. Stop if desired efficiency or # workstations; else go to step 4
B A D C Drawing A Precedence Diagram Work element Precedence time Press out sheet of fruit - 0.1 Cut into strips A 0.2 Outline fun shapes A 0.4 Roll up and package B, C 0.3 0.2 0.3 0.1 0.4
production time available desired output C = Computing Cycle Time Maximum time product can spend at any station What cycle time do we need to produce 6,000 units in a 40 hour week? 40 x 60 6,000 C = = 0.4
0.2 B 0.3 0.1 A D 0.4 C Flow Time vs. Cycle Time • Flow time = time to complete all stations • Cycle time = max time spent at any station Flow time = 0.1 + 0.2 + 0.4 + 0.3 = 1.0 Cycle time = max (0.1, 0.2, 0.4,0.3) = 0.4 0.1, 0.2 0.4 0.3
1 2 3 A, B C D 0.3 min 0.4 min 0.3 min Balancing The Line - Straight Line Workstation TaskRemaining time Feasible tasks 1 A 0.3 B B 0.1 none 2 C 0.0 none 3 D 0.1