Download

1 / 24
260 likes | 544 Views
Absolute Advantage. CHAPTER 2. Introduction. By using the supply and demand diagram this chapter makes a first step in helping you to answer these questions Why does a country export a particular good? Why does it import a particular good?

E N D
Absolute Advantage CHAPTER 2
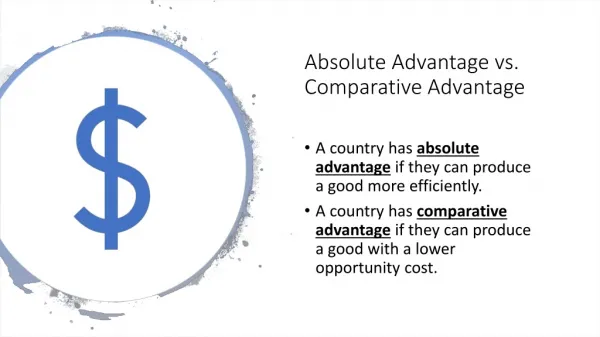
Introduction • By using the supply and demand diagram this chapter makes a first step in helping you to answer these questions • Why does a country export a particular good? • Why does it import a particular good? • What forces are behind the expansion of world trade that is occurring in the world economy? • Absolute advantage • Possibility that, due to differences in supply conditions, one country can produce a product at a lower price than another country
Supply and Demand in a Domestic Market • Throughout the world, rice is exchanged in markets • Supply curve is upward sloping—firms supply more rice to the market as the price increases • Changes in price are represented in the diagram by movements along the supply curve—changes in quantity supplied • Reductions in input prices and improvements in technology shift the supply curve to the right • Increases in input prices and technology setbacks shift the supply curve to the left • Known as changes in supply
Supply and Demand in a Domestic Market • Demand curve is downward sloping—consumers demand less rice from market as price increases • Changes in price are represented by movements along the demand curve—changes in quantity demanded • Additional demand-side factors • Incomes and preferences • Increases shift demand curve to right • Decreases shift demand curve to left • Shifts are known as changes in demand
Supply and Demand in a Domestic Market • Intersection of supply and demand curves determines the equilibrium in the domestic rice market • Any shifts will change equilibrium price and quantity for rice by shifting the demand or supply curves. • Rice markets are international • Cannot analyze them effectively using Figure 2.1
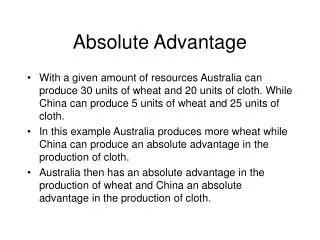
Absolute Advantage • Rice is produced in both Vietnam and Japan • Assume demand conditions are exactly the same in both countries • Implies demand curves for rice in the two countries are exactly the same • Trade often arises due to differences in supply conditions • Assume supply curve for Vietnam is farther to the right than supply curve for Japan • At every price Vietnam supplies more rice than Japan • Perhaps Vietnam uses superior technology or production inputs are lower in Vietnam
Autarky Price • Since no trade is involved between Vietnam and Japan • These two prices are known in international economics as autarky prices • Autarky is a situation in which a country has no economic relationships with other countries • Figure 2.3 depicts a situation in which autarky price of rice is lower in Vietnam than in Japan • Vietnam has an absolute advantage in the production of rice vis-à-vis Japan
International Trade • Absolute advantage implies a potential pattern of trade • If the two countries forgo autarky and begin to trade • World price of rice will lie somewhere between the two autarky prices, or • PV < PW < PJ • This situation is depicted in Figure 2.4
A Question • What ensures that the amount exported by Vietnam is the same as the amount imported by Japan? • If EV were smaller than ZJ there would be excess demand or a shortage in world market for rice • Excess demand causes price to rise • As PW rose, exports of Vietnam would expand and imports of Japan would contract until excess demand in world market disappeared • Similarly, if EV were larger than ZJ, PW would fall to bring world market back into equilibrium
Summary • Differences in supply conditions among countries rise to complementary patterns of absolute advantage • These patterns of absolute advantage make possible complementary patterns of international trade
Gains from Trade • Given a pattern of absolute advantage, it is possible for a country to give up autarky in favor of importing or exporting • Japan can import rice, and Vietnam can export rice • But should a country actually do this?
Gains from Trade—Vietnam • When Vietnam moved from autarky to exporting in the rice market • Producers experience both an increase in price and an increase in quantity supplied along the supply curve • Should be good for producers • Figure 2.6 shows an increase in producer surplus of area A+B as a result of the movement from autarky to trade • Consumers experience an increase in price and a decrease in quantity demanded along the demand curve • Should harm consumers • Figure 2.6 shows a decrease in consumer surplus of area A
Gains from Trade—Vietnam • What do these effects mean for Vietnam? • Producers have gained area A+B • Consumers have lost area A • Gain to producers exceeds loss to consumers • For economy as a whole there is a net welfare increase of area B • Vietnam gains from its entry into world economy as an exporter
Gains from Trade—Japan • When Japan moved from autarky to importing in the rice market • Producers experience a decrease in price and a decrease in quantity supplied along the supply curve • Should harm these producers • You can see in Figure 2.6 that there has been a decrease in producer surplus of area C • Consumers experience a decrease in price and an increase in quantity demanded • Contribute to an increase in consumer surplus of area C + D
Gains from Trade—Japan • What do these effects mean for Japan? • Consumers have gained C+D • Producers have lost area C • The gain to consumers exceeds the loss to producers • For the economy as a whole, then, there is a net welfare increase of area D • Japan gains from its entry into the world economy as an importer
Gains from Trade • Moving from autarky to either importing or exporting involves a net increase in welfare for the country involved • Known as gains from trade • Many popular writings on the world economy suggest trade relationships are a win-lose proposition for the countries involved • The gains from trade idea, however, tells us that trade can be mutually beneficial to countries involved
Two Warnings • Trade can improve overall welfare for the countries involved • Concept has its limits • Suggests the possibility that a country could not have an absolute advantage in anything, and would have nothing to export at all • This is unlikely
Two Warnings • The notion of the gains from trade also has its limits • Suggests that countries as a whole mutually gain from trade • Does not suggest, however, that everyone within a country will gain from trade • Producers of rice in Japan lose from trade, and consumers of rice in Vietnam lose from trade