Download
1 / 25
250 likes | 413 Views
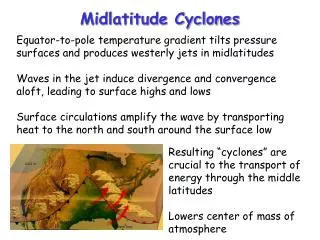
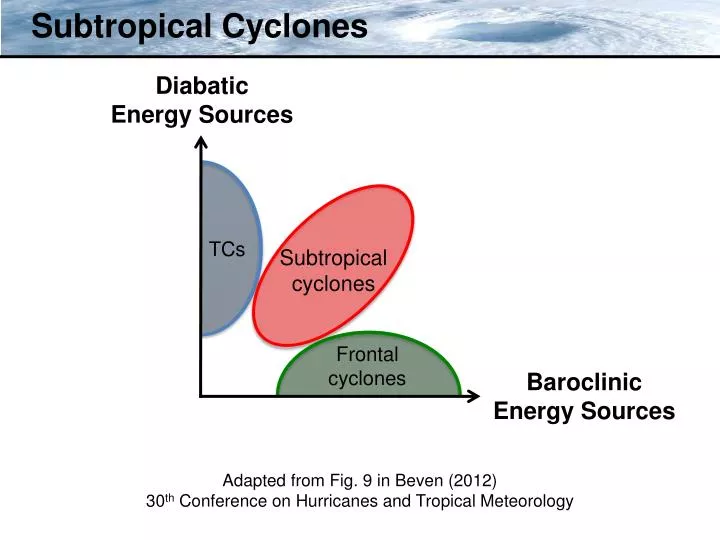
Subtropical Cyclones. Diabatic Energy Sources. TCs. Subtropical cyclones. Frontal cyclones. Baroclinic Energy Sources. Adapted from Fig. 9 in Beven (2012) 30 th Conference on Hurricanes and Tropical Meteorology. Adapted Davis (2010) Methodology. Davis (2010) methodology:

E N D
Subtropical Cyclones DiabaticEnergySources TCs Subtropical cyclones Frontal cyclones BaroclinicEnergy Sources Adapted from Fig. 9 in Beven (2012)30th Conference on Hurricanes and Tropical Meteorology
Adapted Davis (2010) Methodology • Davis (2010) methodology: • Based on Ertel potential vorticity (PV) • Formulated in terms of two PV metrics that quantify the relative contributions of baroclinicprocesses and condensation heating to the evolution of individual cyclones • Davis (2010) methodology is similar to Hart (2003) cyclone phase space diagrams
Adapted Davis (2010) Methodology • Lower-troposphericbaroclinic processes:(near-surface potentialtemperature anomaly) 425 hPa Length of 6° box centered on cyclone Potential temperature anomaly absolute vorticity
Adapted Davis (2010) Methodology absolute vorticity • Lower-troposphericbaroclinic processes:(near-surface potentialtemperature anomaly) • Midtroposphericlatent heat release:(interior PVanomaly) 425 hPa Length of 6° box centered on cyclone Potential temperature anomaly Ertel PV anomaly PV1/PV2 : measure of the contribution of lower-troposphericbaroclinic processes relative to the contribution of condensation heating
Adapted Davis (2010) Methodology 200 hPa 925 hPa
Adapted Davis (2010) Methodology • Lower-troposphericbaroclinic processes:(near-surface potentialtemperature anomaly) 200 hPa 925 hPa Lower-tropospheric baroclinic processes (PV1)
Adapted Davis (2010) Methodology • Lower-troposphericbaroclinic processes:(near-surface potentialtemperature anomaly) • Midtroposphericlatent heat release:(interior PV anomaly) 200 hPa 925 hPa Lower-tropospheric baroclinic processes (PV1)
Adapted Davis (2010) Methodology • Lower-troposphericbaroclinic processes:(near-surface potentialtemperature anomaly) • Midtroposphericlatent heat release:(interior PV anomaly) 200 hPa 500 hPa Midtroposphericlatent heat release (PV2) 925 hPa Lower-tropospheric baroclinic processes (PV1) PV1/PV2 : measure of the contribution of lower-tropospheric baroclinic processes relative to the contribution of condensation heating
Adapted Davis (2010) Methodology • Additional metric introduced to diagnose upper-tropospheric dynamical processes • Upper-troposphericdynamical processes:(upper-tropospheric PV anomaly) Ertel PV anomaly 300 hPa Length of 6° box centered on cyclone
Adapted Davis (2010) Methodology • Lower-troposphericbaroclinic processes:(near-surface potentialtemperature anomaly) • Midtroposphericlatent heat release:(interior PV anomaly) 200 hPa 500 hPa Midtroposphericlatent heat release (PV2) 925 hPa Lower-tropospheric baroclinic processes (PV1) PV1/PV2 : measure of the contribution of lower-troposphericbaroclinic processes relative to the contribution of condensation heating
Adapted Davis (2010) Methodology • Lower-troposphericbaroclinic processes:(near-surface potentialtemperature anomaly) • Midtroposphericlatent heat release:(interior PV anomaly) • Upper-troposphericdynamical processes:(upper-tropospheric PV anomaly) Upper-troposphericdynamical processes(PV3) 200 hPa 500 hPa Midtroposphericlatent heat release (PV2) 925 hPa Lower-tropospheric baroclinic processes (PV1) PV1/PV2 : measure of the contribution of lower-troposphericbaroclinic processes relative to the contribution of condensation heating
Adapted Davis (2010) Methodology Upper-troposphericdynamical processes(PV3) 200 hPa Calculated from the 0.5° Climate ForecastSystem Reanalysis V2 dataset 500 hPa Midtroposphericlatent heat release (PV2) 925 hPa Lower-tropospheric baroclinic processes (PV1) PV1/PV2 : measure of the contribution of lower-troposphericbaroclinic processes relative to the contribution of condensation heating
Hurricane Sandy: 6° × 6° box, NHC Best Track Peaks in PV3 PVU PV1/PV2 22 October 23 October 24 October 25 October 26 October 27 October 28 October 29 October 30 October 31 October
Hurricane Sandy: 10° × 10° box, NHC Best Track Peaks in PV3 PVU PV1/PV2 22 October 23 October 24 October 25 October 26 October 27 October 28 October 29 October 30 October 31 October
Hurricane Sandy: 12° × 12° box, NHC Best Track Peaks in PV3 PVU PV1/PV2 22 October 23 October 24 October 25 October 26 October 27 October 28 October 29 October 30 October 31 October
Hurricane Sandy: 14° × 14° box, NHC Best Track Peaks in PV3 PVU PV1/PV2 22 October 23 October 24 October 25 October 26 October 27 October 28 October 29 October 30 October 31 October
Hurricane Sandy: 16° × 16° box, NHC Best Track Peaks in PV3 PVU PV1/PV2 22 October 23 October 24 October 25 October 26 October 27 October 28 October 29 October 30 October 31 October
Hurricane Sandy: 18° × 18° box, NHC Best Track Peaks in PV3 PVU PV1/PV2 22 October 23 October 24 October 25 October 26 October 27 October 28 October 29 October 30 October 31 October
Hurricane Sandy: 20° × 20° box, NHC Best Track Peaks in PV3 PVU PV1/PV2 22 October 23 October 24 October 25 October 26 October 27 October 28 October 29 October 30 October 31 October
Adapted Davis (2010) Methodology • Lower-troposphericbaroclinic processes:(near-surface potentialtemperature anomaly) • Midtroposphericlatent heat release:(interior PV anomaly) • Upper-troposphericdynamical processes:(upper-tropospheric PV anomaly) Upper-troposphericdynamical processes(PV3) 200 hPa 500 hPa Midtroposphericlatent heat release (PV2) 925 hPa Lower-tropospheric baroclinic processes (PV1) PV1/PV2 : measure of the contribution of lower-troposphericbaroclinic processes relative to the contribution of condensation heating
Adapted Davis (2010) Methodology • Lower-troposphericbaroclinic processes:(near-surface potentialtemperature anomaly) • Midtroposphericlatent heat release:(interior PV anomaly) • Upper-troposphericdynamical processes:(upper-tropospheric PV anomaly) Upper-troposphericdynamical processes(PV3) 200 hPa 300 hPa Midtroposphericlatent heat release (PV2) 925 hPa Lower-tropospheric baroclinic processes (PV1) PV1/PV2 : measure of the contribution of lower-troposphericbaroclinic processes relative to the contribution of condensation heating
Hurricane Sandy: 6° × 6° box, 500 hPa, NHC Best Track Peaks in PV3 PVU PV1/PV2 22 October 23 October 24 October 25 October 26 October 27 October 28 October 29 October 30 October 31 October
Hurricane Sandy: 6° × 6° box, 300 hPa, NHC Best Track Peaks in PV3 PVU PV1/PV2 22 October 23 October 24 October 25 October 26 October 27 October 28 October 29 October 30 October 31 October
Adapted Davis (2010) Methodology • Lower-troposphericbaroclinic processes:(near-surface potentialtemperature anomaly) • Midtroposphericlatent heat release:(interior PV anomaly) • Upper-troposphericdynamical processes:(upper-tropospheric PV anomaly) Upper-troposphericdynamical processes(PV3) 200 hPa 300 hPa Midtroposphericlatent heat release (PV2) 925 hPa Lower-tropospheric baroclinic processes (PV1) PV1/PV2 : measure of the contribution of lower-troposphericbaroclinic processes relative to the contribution of condensation heating
Adapted Davis (2010) Methodology Upper-troposphericdynamical processes(PV3) 200 hPa Calculated from the 0.5° Climate ForecastSystem Reanalysis V2 dataset 500 hPa Midtroposphericlatent heat release (PV2) 925 hPa Lower-tropospheric baroclinic processes (PV1) PV1/PV2 : measure of the contribution of lower-troposphericbaroclinic processes relative to the contribution of condensation heating