Download
1 / 30
300 likes | 420 Views
Large Irregular Datasets and the Computational Grid. Joel Saltz University of Maryland College Park Computer Science Department Johns Hopkins Medical Institutions Pathology Department. Computational grids and Irregular Multidimensional Datasets.

E N D
Large Irregular Datasets and the Computational Grid Joel Saltz University of Maryland College Park Computer Science Department Johns Hopkins Medical Institutions Pathology Department
Computational grids and Irregular Multidimensional Datasets • Spatial/multidimensional multi-scale, multi-resolution • Applications select portions of one or more datasets • Selection of data subset makes use of spatial index (e.g. R tree or quad tree) • Data not used “as-is”, generally preprocessing is needed • Databases to carry out spatial queries and data aggregation in irregular multidimensional datasets
Querying Irregular Multidimensional Datasets • Irregular datasets • Think of disk based unstructured meshes, data structures used in adaptive multiple grid calculations • indexed by spatial location (e.g. position on earth, position of microscope stage) • Spatial query used to specify iterator • computation carried out on data obtained from spatial query • computation aggregates data - resulting data product size significantly smaller than results of range query
Application Scenarios • Ad-hoc queries or data products from satellite sensor data • Sensor data, fluid dynamics and chemistry codes to predict condition of waterways (e.g. Chesapeake bay simulation) and to carry out reservoir simulation • Browse or analyze (multiresolution) digitized slides from high power light or electron microscopy (1-50Gbytes per digitized slide - 1000’s of slides per day per hospital) • Predict materials properties using electron microscope computerized tomography sensor data • Post-processing, analysis and exploration of data generated by large scientific simulations
Processing Remotely Sensed Data One scan line is 409 IFOV’s • AVHRR Level 1 Data • As the TIROS-N satellite orbits, the Advanced Very High Resolution Radiometer (AVHRR)sensor scans perpendicular to the satellite’s track. • At regular intervals along a scan line measurementsare gathered to form an instantaneous field of view(IFOV). • Scan lines are aggregated into Level 1 data sets. NOAA Tiros-N w/ AVHRR sensor • A single file of Global Area Coverage (GAC) data represents: • ~one full earth orbit. • ~110 minutes. • ~40 megabytes. • ~15,000 scan lines.
Spatial IrregularityAVHRR Level 1B NOAA-7 Satellite 16x16 IFOV blocks. Latitude Longitude
Multiscale Physics Based Simulation of Fluid Flow for Energy and Environment
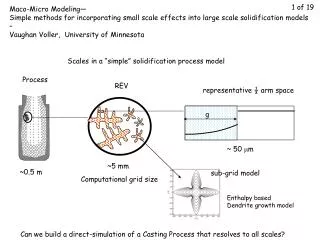
km The Tyranny of Scale simulation scale process scale field scale cm pore scale mm
Bioremediation Simulation abiotic reactions compete with microbes, reduce extent of biodegradation Microbe colonies (magenta) Dissolved NAPL (blue) Mineral oxidation products (green)
Multiblock Methods Lead to Irregular Datasets “Fast Accurate” CO2 Flood Water Flood Fault Upscaling pinchout Fully Implicit Model
Coupling of Different Models(Coupling of Flow Codes with Environmental Quality Codes) Flow Codes Environmental Quality Codes * PADCIRC * UT-BEST Flow input * CE-QUAL-ICM Flow output Projection * UT-PROJ Active Data Repository * Storage, retrieval, processing of multiple datasets from different flow codes
Active Data Repository and MetaChaos • Active Data Repository -- Parallel database infrastructure to query and preprocess multi-scale multiresolution datasets • Projections, interpolations, combining data from different timesteps, single value of new variable from multiple existing variables • Performance prediction techniques for database configuration, query optimization, software and hardware design • MetaChaos -- Tools to couple parallel databases, parallel and distributed application programs
Typical Query Output grid onto which a projection is carried out Specify portion of raw sensor data corresponding to some search criterion
Active Data Repository Design Objectives • Support optimized associative access and processing of multiresolution and irregular persistent data structures • Integrate and overlap a wide range of user-defined operations, in particular, order-independent operations with the basic retrieval functions • Targets parallel and distributed architectures that have been configured to support high I/O rates • Applications -- Titan: Satellite sensor data; Virtual Microscope Server, Bay and Estuary Simulation
Active Data Repository Low End Client Low End Client Low End Client Active Data Repository, MetaChaos Grid Scenarios Out-of-core Parallel Application High End Parallel Application Active Data Repository Globus Locate network, compute, data resources Sensor or Parallel Simulation (generates data) Metachaos/Globus
Active Data Repository Active Data Repository Active Data Repository Proxy Server Radiology Viewer Radiology Viewer Virtual Microscope Virtual Microscope Radiology Viewer Virtual Microscope Various Clients Grid Scenarios
Clients Queries Outputs Query Interface Service Query Planning Service Query Execution Service Active Data Repository (ADR) Attribute Space Service Data Aggregation Service Data Loading Service Indexing Service Customization Architecture of Active Data Repository
Water Contamination Studies (Parallel Program) Visualization CHEMICAL TRANSPORT CODE (Parallel Program) FLOW CODE Grid used by chemical transport code POST-PROCESSING (Time averaging, projection) Simulation Time * Locally conservative projection * Management of large amounts of data Hydrodynamics output (velocity,elevation) on unstructured grid
Water Contamination Studies Partition FLOW CODE into chunks TRANSPORT CODE Attribute spaces of simulators POST-PROCESSING (Time averaging) Register, Integrate Attribute Space Service Data Loading Service Data Aggregation Service Indexing Service Active Data Repository (ADR) Chunks loaded to disks Index created
Water Contamination Studies Output Grid TRANSPORT CODE Query: * Time period * Input grid * Output grid * Post-processing function (Time Averaging) POST-PROCESSING (Projection) Query Interface Service Query Planning Service Query Execution Service ADR Attribute Space Service Data Aggregation Service Data Loading Service Indexing Service
Performance Prediction -- Application Emulators • Performance prediction: • How to configure database • data partitioning • how many compute processes and where should they run • Performance of database various possible architectures • standard architectures, petaflop, active disks • Insight into how to improve software design to optimize performance
Performance Prediction -- Application Emulators • Application Emulators: • Parameterized program designed to mimic application computation and data movement patterns • Focus is on lower layers of memory hierarchy, computational details, cache behavior are abstracted • Coarse grained, executable description of patterns of data movement and computation • Simulator suite to project performance to varying levels of accuracy
Comparison of Real Application and Emulator(Maryland 16 processor IBM SP2) Number of operations, 60-day data Number of operations, 10-day data
Non-scaled Input Satellite Data Processing (SP-2) Scaled Input
P M Serial link M M M M P P P P Active Disk Architecture • Restructure apps • Disk-resident code • bulk processing • disklet • Host-resident code • coordination • communication • combination • Processing power scales naturally with storage capacity • Processing power evolves with storage
Experiments • Compared algorithm-architecture combinations • current and future configurations • Evaluated scalability • configuration: 4-32 disks • dataset size • Evaluated impact of host upgrades
Conclusion • Large irregular datasets are coming to your computational grid • Database software can hide complexity of exploiting large irregular datasets • Performance methodology for configuring database, for choosing target architectures and in predicting cost of queries
Ongoing and Open Issues • Integration into metacomputing environment • ADR metadata to be stored in NPACI SRBs and Globus MDS • Process placement and communication coordinated by Globus, scheduled by APpLes • Coupling ADR with parallel programs coordinated by MetaChaos • Integration into object-relational framework • Appropriate query language • Compile-time/runtime optimizations • intermodule tiling