Download
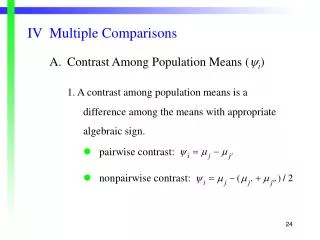
1 / 22
310 likes | 791 Views
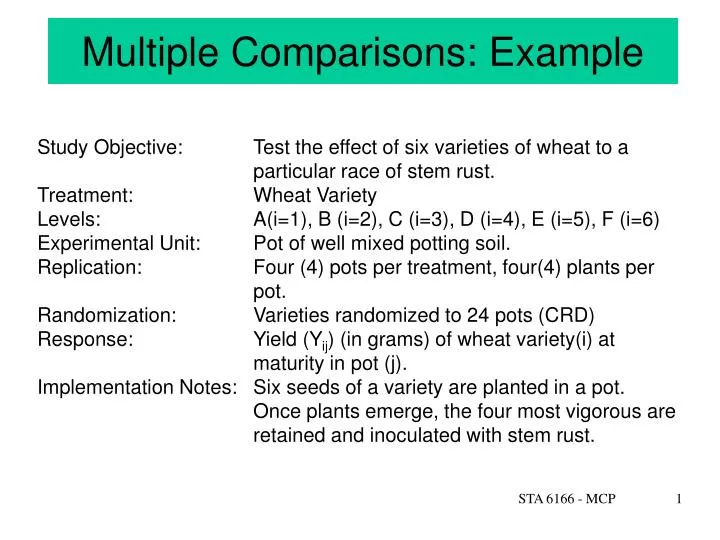
Multiple Comparisons: Example. Study Objective: Test the effect of six varieties of wheat to a particular race of stem rust. Treatment: Wheat Variety Levels: A(i=1), B (i=2), C (i=3), D (i=4), E (i=5), F (i=6) Experimental Unit: Pot of well mixed potting soil.

E N D
Multiple Comparisons: Example Study Objective: Test the effect of six varieties of wheat to a particular race of stem rust. Treatment: Wheat Variety Levels: A(i=1), B (i=2), C (i=3), D (i=4), E (i=5), F (i=6) Experimental Unit: Pot of well mixed potting soil. Replication: Four (4) pots per treatment, four(4) plants per pot. Randomization: Varieties randomized to 24 pots (CRD) Response: Yield (Yij) (in grams) of wheat variety(i) at maturity in pot (j). Implementation Notes: Six seeds of a variety are planted in a pot. Once plants emerge, the four most vigorous are retained and inoculated with stem rust. STA 6166 - MCP
Statistics and AOV Table Rank Variety Mean Yield 5 A 50.3 4 B 69.0 6 C 24.0 2 D 94.0 3 E 75.0 1 F 95.3 n1=n2=n3=n4=n5=n=4 ANOVA Table Source df MeanSquare F Variety 5 2976.44 24.80** Error 18 120.00 STA 6166 - MCP
Overall F-test indicates that we reject H0 and assume HA Which mean is not equal to which other means. Consider all possible comparisons between varieties: First sort the treatment levels such that the level with the smallest sample mean is first down to the level with the largest sample mean. Then in a table (matrix) format, compute the differences for all of the t(t-1)/2 possible pairs of level means. STA 6166 - MCP
Differences for all of the t(t-1)/2=15 possible pairs of level means Largest Difference Smallest difference Question: How big does the difference have to be before we consider it “significantly big”? STA 6166 - MCP
Fisher’s Protected LSD F=24.8 > F5,18,.05=2.77 --> F is significant ‡ ‡ ‡ ‡ ‡ ‡ ‡ ‡ ‡ ‡ ‡ ‡ ‡ Implies that the two treatment level means are statistically different at the a = 0.05 level. ‡ c a b c d d Alternate ways to indicate grouping of means. STA 6166 - MCP
Tukey’s W (Honestly Significant Difference) Not protected hence no preliminary F test required. Table 10 Ott&Longnecker ‡ ‡ ‡ ‡ ‡ ‡ ‡ ‡ ‡ ‡ ‡ Implies that the two treatment level means are statistically different at the a = 0.05 level. a b bc c d d d STA 6166 - MCP
Student-Newman-Keul Procedure (SNK) Not protected hence no preliminary F test required. Table 10 row Error df=18 a = 0.05 col = r neighbors One between Two between STA 6166 - MCP
SNK ‡ ‡ ‡ ‡ ‡ ‡ ‡ ‡ ‡ ‡ ‡ ‡ ‡ ‡ Implies that the two treatment level means are statistically different at the a = 0.05 level. a b c c d d STA 6166 - MCP
Duncan’s New Multiple Range Test Not protected hence no preliminary F test required. Table on Next page row Error df=18 a = 0.05 col = r neighbors One between Two between STA 6166 - MCP
Duncan’s Test Critical values STA 6166 - MCP
Duncan’s MRT ‡ ‡ ‡ ‡ ‡ ‡ ‡ ‡ ‡ ‡ ‡ ‡ ‡ ‡ Implies that the two treatment level means are statistically different at the a = 0.05 level. a b c c d d STA 6166 - MCP
Waller-Duncan K-Ratio MCP (Protected) F=24.8 > F5,18,.05=2.77 => F is significant Fisher LSD=16.27) Table next page, F=25, row=2-4 col=18 ‡ ‡ ‡ ‡ ‡ ‡ ‡ ‡ ‡ ‡ ‡ ‡ ‡ ‡ Implies that the two treatment level means are statistically different at the a = 0.05 level. a b c c d d STA 6166 - MCP
Waller-Duncan MRT Critical Values STA 6166 - MCP
Waller Duncan TableK=500 STA 6166 - MCP
Scheffé’s S Method F=24.8 > F5,18,.05=2.77 => F is significant For comparing Reject Ho: l=0 at a=0.05 if Since each treatment is replicated the same number of time, S will be the same for comparing any pair of treatment means. STA 6166 - MCP
Scheffe’s S Method Any difference larger than S=28.82 is significant. ‡ ‡ ‡ ‡ ‡ ‡ ‡ Implies that the two treatment level means are statistically different at the a = 0.05 level. a a b b c b c c c Very conservative => Experimentwise error driven. STA 6166 - MCP
Grouping of Ranked Means LSD SNK Duncan’s Waller-Duncan Tukey’s HSD Scheffe’s S Which grouping will your use? 1) What is your risk level? 2) Comparisonwise versus Experimentwise error concerns. STA 6166 - MCP
Which method to use? Some practical advice • If comparisons were decided upon before examining the data (best): • Just one comparison – use the standard (two-sample) t-test. • Few comparisons – use Bonferroni adjustment to the t-test. With m comparisons, use /m for the critical value. • Many comparisons – Bonferroni becomes increasingly conservative as m increases. At some point it is better to use Tukey or Scheffe. • If comparisons were decided upon after examining the data: • Just want pairwise comparisons – use Tukey. • All contrasts (linear combinations of treatment means) – use Scheffe. STA 6166 - MCP