Download
1 / 34
350 likes | 554 Views
E-PRTR Reporting and Water Emissions. Anthea Southey Inspector Office of Environmental Enforcement. Outline of Presentation. Background to PRTR Benefits of the PRTR EPA role as competent authority Licensed Facility role in reporting data under PRTR Common Reporting Errors

E N D
E-PRTR Reporting and Water Emissions Anthea Southey Inspector Office of Environmental Enforcement
Outline of Presentation • Background to PRTR • Benefits of the PRTR • EPA role as competent authority • Licensed Facility role in reporting data under PRTR • Common Reporting Errors • AER/PRTR Reporting Update 2010 • The E_PRTR website and the development of a National website for PRTR.
What is PRTR? • The European Pollutant Release and Transfer Register is an inventory of pollutant emissions from industry and other sources. The aim of the inventory is to make information on pollutant emissions and waste transfers more available to the public. This helps to increase public awareness on environmental matters, allows a free exchange of views, more effective participation on environmental decision-making and, eventually, to a better environment.
Benefits of PRTR Data Collection • The PRTR dataset facilitates the following : • provides public access to information on industrial releases of pollutants and waste transfers • useful for tracking of emission trends • provides valuable data for enforcement reports and other reports • demonstrates progress in pollution reduction • evaluates progress relating to environmental policies and goals.
Benefits to stakeholders • Benefits for Industry • Driver for Pollution Reduction • Dissemination of E-PRTR data enables similar industries to benchmark their environmental performance with other companies in the sector and to reduce emissions with financial savings • E-PRTR information can encourage industry and business to examine environmental costs, reduce emissions and waste transfers and to adopt cleaner production techniques – e.g. CGPP etc. • E-PRTR data can be used in licensing decisions for new plants and facilities.
The E-PRTR Dataset • The E-PRTR data is displayed on the European PRTR website: http://prtr.ec.europa.eu- screenshots later • The E-PRTR includes data from 27 EU Member States • It contains data reported by 24,000 industrial facilities covering 65 economic activities across Europe • It covers 9 industry sectors
The 9 industry Sectors • energy • production and processing of metals • mineral industry • chemical industry • waste and waste water management • paper and wood production and processing • intensive livestock production and aquaculture • animal and vegetable products • other activities.
Putting PRTR in context • PRTR Regulations • E-PRTR Regulation (EC) No. 166/2006; Irish PRTR Regulation S.I. No.123 of 2007 • Particular reference to reporting requirements in Article 5 and quality assurance and assessment in Article 9. • Particular reference to water emissions and data quality.
EPA Role • Referring to Article 9 of the E-PRTR Directive: • The competent authorities shall assess the quality of the data providedby the operators of the facilities, in particular as to their completeness, consistency and credibility. • Other aspects fo EPA Role • Provision of reporting guidance on the EPA website: • General guidance • Sector specific guidance • Calculation tools – UWWTPs, Quarries and Intensive Ag. • Support through PRTR helpdesk: aerreturns@epa.ie • Data Validation and assessment • Reporting E_PRTR data to the EU Commission • On reported emissions/waste transfers which exceed threshold in Annex II of E-PRTR Regulations (EC) No. 166/2006
Facility Operator Role • Referring to Article 5 of the E-PRTR Directive: • The operator of each facility shall report annually to its competent authority, along with an indication of whether the information is based on measurement, calculation or estimation, of the following: • Releases to air, water and land of any pollutant specified in Annex 11 for which the applicable threshold value is exceeded. • Off-site transfers of hazardous waste (> 2 tonnes per year) or of non-hazardous waste (> 2,000 tonnes per year). • Off-site transfers of any pollutantspecified in Annex 11 in waste water destined for wastewater treatment for which the applicable threshold value is exceeded.
Reporting obligations under PRTR • All EPA licensed activities and some unlicensed activities. • Annual Submission of the AER and PRTR Emissions Reporting Workbook by 31st March each year. • Note: Username and password does not change from year to year • PRTR reporting requirements: • Reporting of annual mass emissions of PRTR pollutants and licensed pollutants in Kg/annum • Releases to Air, Water and Wastewater • Methods of Measurement (M,C, E) and description of methods • Waste Transfers with EWC Codes and R/D Codes in tonnes per annum
Reporting Errors – common errors • Emission to Water or Emission to Sewer : • Use of Incorrect units e.g. tonnes instead of kg • Emissions not credible when compared to previous year • Not all licensed emission points reported • Not all pollutants reported (PRTR pollutants and licensed parameters). Refer to your Licence and to the EU PRTR Guidance Doc - Appendix 3 for indicative PRTR pollutants by Sector. • Accidental emissions not reported • Fugitive emissions not reported • Reporting does not reflect correct emission type e.g. emission is reported to surface water instead of wastewater/sewer
….common errors continued • Method of Measurement • Need to specifiy if the emission is based on: • Measurement (M) – release data based on direct monitoring results which need to be converted to annual mass emissions. Flow data is required for the conversion to annual mass emissions in Kg/annum. • Calculation (C) – release data based on calculations using activity data (fuel use, production rates, etc) and emission factors or mass balance calculations. • Estimation (E) – release data based on non-standardised estimations, calculation tools, expert guesses and assumptions. • Choice of Method Codes can be incorrect – see examples later • Description of measurement methods not clear– see examples later
Measurement Methods and Codes Method Code When to Use it Description Field PER If the facilities license specifies a specific Standard Method they must work to – this tends to be arare case. Standard Code / Name ISO / EN Only for approved standard methods - EN/ISO/CEN (check EU PRTR guidance document for the list). Leave Blank ALT If the facility is using a CEN or ISO standard but not one in the PRTR Guidance, this can be the case from time to time. Standard Code Name CRM If a facility is using a non-ISO method validated using certified reference materials and acceptable to the competent authority (only applies to a few cases). Standard code or method description OTH If not using a standard method. Description of method e.g. Hach Method, ICP_MS, Colorimetric, etc.
Calculation Methods and Codes ISO / EN Only for approved standard methods as listed in the PRTR Eu Guidance (check guidance list) Leave Blank Method Code When to Use it Description Field PER If the facility’s license specifies a specific calculation method to be used. Description of method NRB – not used very much in Ireland’s case. National or Regional binding calculation methodology prescribed by legal act for the pollutant and facility concerned. Description of Method ETS For CO2 emissions and facilities that are part of the ETS. Leave Blank MAB Mass balance method, which is accepted by competent authority. Description of Method. OTH If not using a standard calculation method e.g. it is based on fuel consumption or a non-standard calculation methodology that has been approved by the EPA E.G. GAS SIM LITE, EPA Emission Calculation Tool etc. Description of calculation method or name of calculation tool
No. Annex II Name M, C or E Method Code Designation or Description 17 Arsenic and compounds (as As) M I.S. EN 14385 12 Total Nitrogen M EN ISO 11905-1:1998 Example 1 ISO/EN – Standard Method from the approved PRTR EU Guidance list. EN number is entered as the method code and Description field is left blank
Annex II Name M/C/E Method Code Designation or Description 07 Non-methane volatile organic compounds (NMVOC) C MAB Mass balance calculation. 08 Nitrogen oxides (NOx/NO2) M OTH Chemiluminescence/Non Dispersive Infrared 11 Sulphur oxides (SOx/SO2) M OTH Non Dispersive Infrared 34 Total Phosphorus M OTH Example 2 Method Codes – OTH and MAB - For non-EN/ISO method - analytical method is outlined in the Description field. Standard Methods, 2005, 21st Edition,Method 4500-P D
No. Annex II Name M/C/E Method Code Designation or Description 13 Total phosphorus M CRM US EPA Std. Mtds. 4500-P E 76 Total organic carbon (TOC) M CRM US EPA Std. Mtds. 5220 D Example 3 CRM Example - The facility is not using a ISO/CEN method. But is using an equivalent methodology that has been validated using certified reference materials. The method should be acceptable to the competent authority.
Example 4 Example of Use of Method Code PER – The license specifies use of a Specific Method. This is found mostly for the monitoring of air emissions. No specific example for water emissions. Air Emission Example from an EPA Licence: Parameter: Dioxin (as TEQ as specified in Schedule B of this Licence) Monitoring Frequency: Annually Method: U.S. EPA Method 23 or as updated by CEN standard
Method Code M, C, E Method Description
Some of the improvements to the PRTR Emissions Reporting Workbook for 2010 • Addition of a Prompt for the selection of the Method Code - restrict the choice of Method Code to EN/ISO, OTH, ALT, PER, etc. Also updates to the linked Method Code Help sheet. • A new worksheet will be added to the workbook called “Previous years data” which will display all data entered for the previous year. The new data will be checked against previous year’s data and a warning will come up if data has changed by +/- 50%. • Reminder box will prompt the use of the correct units for each Section of the Workbook. • UWW Reporting –the operator will use a macro to populate the PRTR Emissions Reporting Workbook (Emissions to Air and Water Sections) directly from the UWW Calculation Tool (V4).
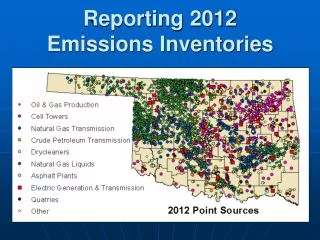
Facility Search Map and details on pollutant releases to water
Development of a National PRTR website • A National PRTR website will be developed in conjunction with the ratification of the PRTR Protocol by Ireland. This will probably take place in mid-2011. • The website should display all Irish facilities which are covered by the PRTR Regulations • It should provide details on pollutants and waste transfers that are above the E_PRTR thresholds.
Final Points to Note • The EU Commission is reviewing the E_PRTR Regulations and are considering the lowering of thresholds for some of the pollutants which will mean that more facilities will have data that is reportable to Europe. • The first cycle of triennial reporting (2007 to 2009) by Member States is required by the end of March 2011.