Download
1 / 1
10 likes | 165 Views
Population Pharmacokinetic/Pharmacodynamic Modeling and Simulations of the Effect of LY2216684 on Heart Rate and the Norepinephrine Metabolite, 3, 4-dihydroxyphenylglycol (DHPG), in Plasma and Cerebrospinal Fluid (CSF). Tonya Quinlan, B.S.; William Kielbasa, Ph.D.

E N D
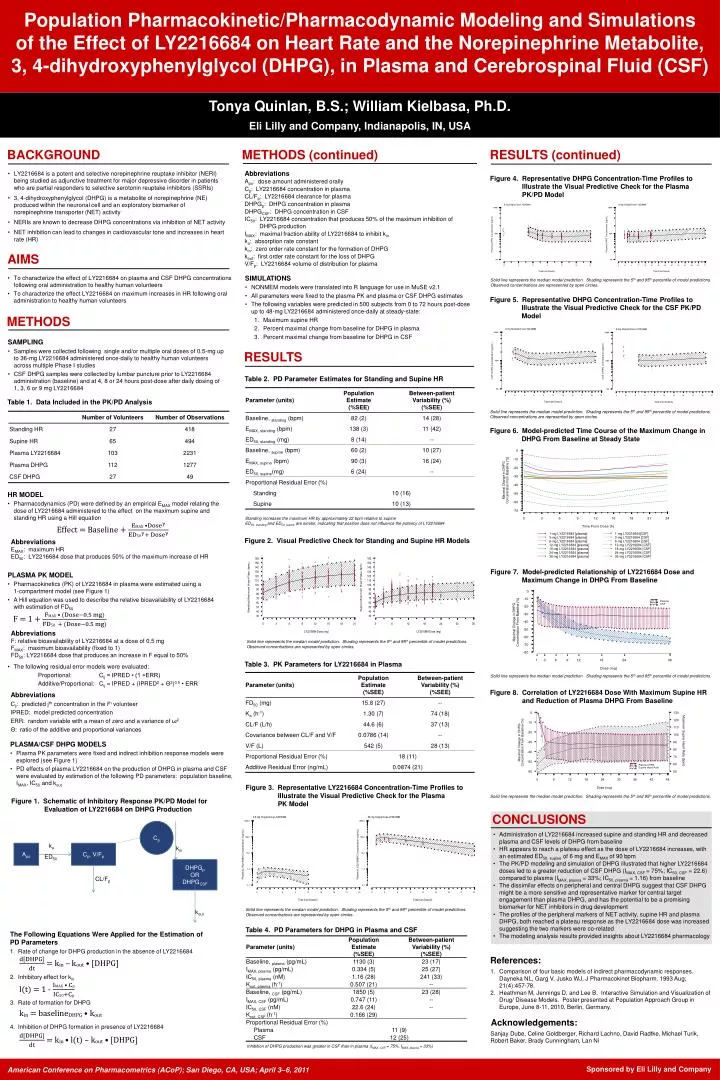
Population Pharmacokinetic/Pharmacodynamic Modeling and Simulations of the Effect of LY2216684 on Heart Rate and the Norepinephrine Metabolite, 3, 4-dihydroxyphenylglycol (DHPG), in Plasma and Cerebrospinal Fluid (CSF) Tonya Quinlan, B.S.; William Kielbasa, Ph.D. Eli Lilly and Company, Indianapolis, IN, USA BACKGROUND METHODS (continued) RESULTS (continued) Abbreviations Apo: dose amount administered orally Cp: LY2216684 concentration in plasma CL/Fp: LY2216684 clearance for plasma DHPGp: DHPG concentration in plasma DHPGCSF: DHPG concentration in CSF IC50: LY2216684 concentration that produces 50% of the maximum inhibition of DHPG production IMAX: maximal fraction ability of LY2216684 to inhibit kin ka: absorption rate constant kin: zero order rate constant for the formation of DHPG kout: first order rate constant for the loss of DHPG V/Fp: LY2216684 volume of distribution for plasma • LY2216684 is a potent and selective norepinephrine reuptake inhibitor (NERI) being studied as adjunctive treatment for major depressive disorder in patients who are partial responders to selective serotonin reuptake inhibitors (SSRIs) • 3, 4-dihydroxyphenylglycol (DHPG) is a metabolite of norepinephrine (NE) produced within the neuronal cell and an exploratory biomarker of norepinephrine transporter (NET) activity • NERIs are known to decrease DHPG concentrations via inhibition of NET activity • NET inhibition can lead to changes in cardiovascular tone and increases in heart rate (HR) Figure 4. Representative DHPG Concentration-Time Profiles to Illustrate the Visual Predictive Check for the Plasma PK/PD Model Cp AIMS ka Apo Cp, V/Fp kin SIMULATIONS • NONMEM models were translated into R language for use in MuSE v2.1 • All parameters were fixed to the plasma PK and plasma or CSF DHPG estimates • The following variables were predicted in 500 subjects from 0 to 72 hours post-dose up to 48-mg LY2216684 administered once-daily at steady-state: • Maximum supine HR • Percent maximal change from baseline for DHPG in plasma • Percent maximal change from baseline for DHPG in CSF • To characterize the effect of LY2216684 on plasma and CSF DHPG concentrations following oral administration to healthy human volunteers • To characterize the effect LY2216684 on maximum increases in HR following oral administration to healthy human volunteers ED50 Solid line represents the median model prediction. Shading represents the 5th and 95th percentile of model predictions. Observed concentrations are represented by open circles. DHPGp OR DHPGCSF Figure 5. Representative DHPG Concentration-Time Profiles to Illustrate the Visual Predictive Check for the CSF PK/PD Model CL/Fp METHODS kout SAMPLING • Samples were collected following single and/or multiple oral doses of 0.5-mg up to 36-mg LY2216684 administered once-daily to healthy human volunteers across multiple Phase I studies • CSF DHPG samples were collected by lumbar puncture prior to LY2216684 administration (baseline) and at 4, 8 or 24 hours post-dose after daily dosing of 1, 3, 6 or 9 mg LY2216684 RESULTS Table 2. PD Parameter Estimates for Standing and Supine HR Table 1. Data Included in the PK/PD Analysis Solid line represents the median model prediction. Shading represents the 5th and 95th percentile of model predictions. Observed concentrations are represented by open circles. Figure 6. Model-predicted Time Course of the Maximum Change in DHPG From Baseline at Steady State HR MODEL • Pharmacodynamics (PD) were defined by an empirical EMAX model relating the dose of LY2216684 administered to the effect on the maximum supine and standing HR using a Hill equation Standing increases the maximum HR by approximately 22 bpm relative to supine ED50, standing and ED50, supine are similar, indicating that position does not influence the potency of LY2216684 Figure 2. Visual Predictive Check for Standing and Supine HR Models Abbreviations EMAX: maximum HR ED50: LY2216684 dose that produces 50% of the maximum increase of HR Figure 7. Model-predicted Relationship of LY2216684 Dose and Maximum Change in DHPG From Baseline PLASMA PK MODEL • Pharmacokinetics (PK) of LY2216684 in plasma were estimated using a 1-compartment model (see Figure 1) • A Hill equation was used to describe the relative bioavailability of LY2216684 with estimation of FD50 • The following residual error models were evaluated: • Proportional: Cij = IPRED • (1 +ERR) • Additive/Proportional: Cij = IPRED + (IPRED2 + Θ2)0.5 • ERR Abbreviations F: relative bioavailability of LY2216684 at a dose of 0.5 mg FMAX: maximum bioavailability (fixed to 1) FD50: LY2216684 dose that produces an increase in F equal to 50% Solid line represents the median model prediction. Shading represents the 5th and 95th percentile of model predictions. Observed concentrations are represented by open circles. Table 3. PK Parameters for LY2216684 in Plasma Solid line represents the median model prediction. Shading represents the 5th and 95th percentile of model predictions. Figure 8. Correlation of LY2216684 Dose With Maximum Supine HR and Reduction of Plasma DHPG From Baseline Abbreviations Cij: predicted jth concentration in the ith volunteer IPRED: model predicted concentration ERR: random variable with a mean of zero and a variance of ω2 Θ: ratio of the additive and proportional variances • PLASMA/CSF DHPG MODELS • Plasma PK parameters were fixed and indirect inhibition response models were explored (see Figure 1) • PD effects of plasma LY2216684 on the production of DHPG in plasma and CSF were evaluated by estimation of the following PD parameters: population baseline, IMAX, IC50 and kout Figure 3. Representative LY2216684 Concentration-Time Profiles to Illustrate the Visual Predictive Check for the Plasma PK Model Solid line represents the median model prediction. Shading represents the 5th and 95th percentile of model predictions. Figure 1. Schematic of Inhibitory Response PK/PD Model for Evaluation of LY2216684 on DHPG Production CONCLUSIONS • Administration of LY2216684 increased supine and standing HR and decreased plasma and CSF levels of DHPG from baseline • HR appears to reach a plateau effect as the dose of LY2216684 increases, with an estimated ED50, supine of 6 mg and EMAX of 90 bpm • The PK/PD modeling and simulation of DHPG illustrated that higher LY2216684 doses led to a greater reduction of CSF DHPG (IMAX, CSF = 75%; IC50, CSF = 22.6) compared to plasma (IMAX, plasma = 33%; IC50, plasma = 1.16) from baseline • The dissimilar effects on peripheral and central DHPG suggest that CSF DHPG might be a more sensitive and representative marker for central target engagement than plasma DHPG, and has the potential to be a promising biomarker for NET inhibitors in drug development • The profiles of the peripheral markers of NET activity, supine HR and plasma DHPG, both reached a plateau response as the LY2216684 dose was increased suggesting the two markers were co-related • The modeling analysis results provided insights about LY2216684 pharmacology Solid line represents the median model prediction. Shading represents the 5th and 95th percentile of model predictions. Observed concentrations are represented by open circles. Table 4. PD Parameters for DHPG in Plasma and CSF The Following Equations Were Applied for the Estimation of PD Parameters Rate of change for DHPG production in the absence of LY2216684 Inhibitory effect for kin Rate of formation for DHPG Inhibition of DHPG formation in presence of LY2216684 References: Comparison of four basic models of indirect pharmacodynamic responses. Dayneka NL, Garg V, Jusko WJ, J Pharmacokinet Biopharm. 1993 Aug; 21(4):457-78. Heathman M, Jennings D, and Lee B. Interactive Simulation and Visualization of Drug/ Disease Models. Poster presented at Population Approach Group in Europe, June 8-11, 2010, Berlin, Germany. Acknowledgements: Sanjay Dube, Celine Goldberger, Richard Lachno, David Radtke, Michael Turik, Robert Baker, Brady Cunningham, Lan Ni Inhibition of DHPG production was greater in CSF than in plasma (IMAX, CSF = 75%, IMAX, plasma = 33%) American Conference on Pharmacometrics (ACoP); San Diego, CA, USA; April 3–6, 2011 Sponsored by Eli Lilly and Company