Download
1 / 46
460 likes | 590 Views
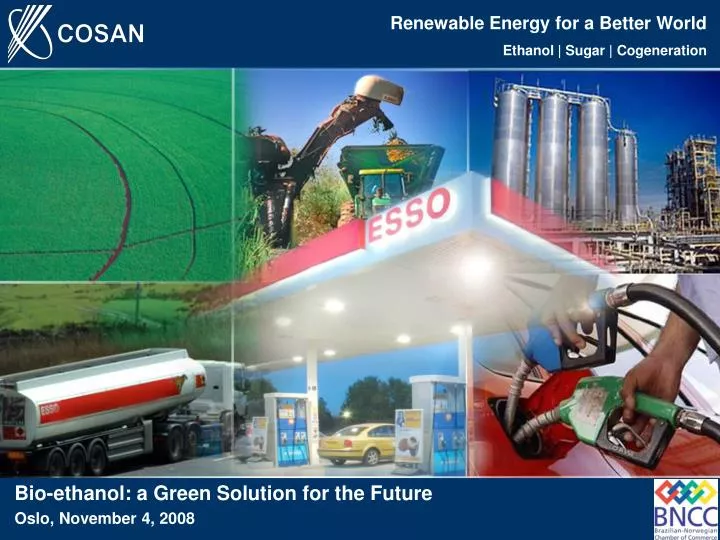
Renewable Energy for a Better World Ethanol | Sugar | Cogeneration. Bio-ethanol: a Green Solution for the Future Oslo, November 4, 2008 . Disclaimer Forward Looking Statements.

E N D
Renewable Energy for a Better World Ethanol | Sugar | Cogeneration Bio-ethanol: a Green Solution for the Future Oslo, November 4, 2008
DisclaimerForward Looking Statements This presentation contains estimates and forward-looking statements regarding our strategy and opportunities for future growth. Such information is mainly based on our current expectations and estimates or projections of future events and trends, which affect or may affect our business and results of operations. Although we believe that these estimates and forward-looking statements are based upon reasonable assumptions, they are subject to several risks and uncertainties and are made in light of information currently available to us. Our estimates and forward-looking statements may be influenced by the following factors, among others: (1) general economic, political, demographic and business conditions in Brazil and particularly in the geographic markets we serve; (2) inflation, depreciation and devaluation of the real; (3) competitive developments in the ethanol and sugar industries; (4) our ability to implement our capital expenditure plan, including our ability to arrange financing when required and on reasonable terms; (5) our ability to compete and conduct our businesses in the future; (6) changes in customer demand; (7) changes in our businesses; (8) government interventions resulting in changes in the economy, taxes, rates or regulatory environment; and (9) other factors that may affect our financial condition, liquidity and results of our operations. The words “believe”, “may”, “will”, “estimate”, “continue”, “anticipate”, “intend”, “expect” and similar words are intended to identify estimates and forward-looking statements. Estimates and forward-looking statements speak only as of the date they were made and we undertake no obligation to update or to review any estimate and/or forward-looking statement because of new information, future events or other factors. Estimates and forward-looking statements involve risks and uncertainties and are not guarantees of future performance. Our future results may differ materially from those expressed in these estimates and forward-looking statements. In light of the risks and uncertainties described above the estimates and forward-looking statements discussed in this presentation might not occur and our future results and our performance may differ materially from those expressed in these forward-looking statements due to, inclusive, but not limited to the factors mentioned above. Because of these uncertainties you should not make any investment decision based on these estimates and forward-looking statements.
Agenda • Introduction to Management • Brazilian Ethanol & the World Market • Cosan’s Enhanced Business Model • Fighting the Myths
Introduction to Management Paulo Diniz -CFO and Investor Relations Officer Luiz Felipe Jansen -Investor Relations Manager
Agenda • Introduction to Management • Brazilian Ethanol & the World Market • Cosan’s Enhanced Business Model • Fighting the Myths
‘Sugarcane’It is a great pleasure to introduce our friend … • Sugarcane is the prime ethanol feedstock in Brazil • Semi-perennial plant: lasts for about 5 crops seasons … with high yields … and has many benefits over traditional row crops • Needs less energy to plant and to cultivate … root system reduces erosion … effective carbon uptake … relatively low defensive & fertilizer requirements … many varieties
The sugarcane evolutionPast, Present & Future shall increasingly favor Cosan 2015 1990 2000 2012 1970 1532 2030 Sugarcane as food - Sugar Predictable growth market Sugarcane as alternative energy - Ethanol Sugarcane in the Brazilian energy matrix – Co-generation Market with strong growth potential Sugarcane as global renewable energy - Ethanol Sugarcane as basic input for the Chemical Industry KYOTO / SHORTAGE OPEC Facts Facts Future • Proálcool Program • Brazilian E100 car • End of Proálcool • Brazilian E25 car • Biomass in the energy auctions • Commercial stages of Flex-Fuel cars in Brazil • Several countries ratifying the Kyoto protocol • Environmental and energy laws in the USA and Europe • Corn ethanol production in the USA • Initial stages of the carbon credits market • Continuous instability over oil exporting countries • Environmental issues disseminated over several countries • Strict CO2 emission targets • Mature carbon credits market • Corn ethanol economic viable as fuel • Cellulose used as ethanol raw material • New technologies for the biomass usage in the chemical industry Source: Canavialis and the company - 7 -
The sugarcane evolutionModification in the Biomass Processing … ATR ATR TSR Sugar 12.1 tones 12.8 tones Planted Area OR 1 hectare Anhydrous Ethanol 7,018 liters Tones in the field 110 tones Anhydrous Ethanol Bagasse Energy Tones at the Mill 7,018 liters 22.1 MWh MWh MWh 23.8 tones 85 tones Energy Cellulose + Hemice Anhydrous Ethanol 22.1 MWh 7.7 tones 4,894 litros Energy Lignina 2.4 tones 5.2 MWh Energy Leaves 23.8 tones 22.1 MWh MWh MWh Cellulose + Hemice . Anhydrous Ethanol 6.8 tones 4,292 liters Energy Lignina 1.9 tones 4.2 MWh Source: Canavialis
The sugarcane evolutionIncrease on Ethanol Output … TSR Sugar Açúcar 12.1 tones 12.8 tones Planted Area OR 1 hectare Anhydrous Ethanol Álcool Anidro 7,018 liters Tones in the field 200 tones Anhydrous Ethanol Energy Bagasse Tones at the Mill 155 tones 43 tones 22,818 liters (3.2x) 22.1 MWh MWh MWh Energy Cellulose + Hemice Anhydrous Ethanol 16.9 MWh (0.7x) 14 tones 8,100 liters Lignina Energy 4.3 tones 9.4 MWh Leaves Palha Energy 43 tones 22.1 MWh MWh MWh Cellulose + Hemice . Anhydrous Ethanol 7,700 liters 12.2 tones Lignina Energy 3.4 tones 7.5 MWh Source: Canavialis
Expected Attractive Industry DynamicsPositive trends in Ethanol, Sugar and Power industries shall benefit Cosan Gradual Deregulationin developed countries Reduction of trade and import restrictions Oil price volatility and supply instability Higher demand for alternative cheaper fuels Pressure for use of renewable and cleaner burning fuels like ethanol Global environmental concerns Migration to urban areas and GDP per capita increase Increase sugar consumption per capita Consolidation in Brazilian ethanol and sugar industries Increase scale and lower production costs Bio mass generationopportunities Ever growing demand for energy Significant ethanol and sugar export opportunities Potentially higher international prices Further strengthening of Brazil’s competitive position Additional and stable revenue stream from cogeneration - 10 -
Flex-fuel car: a remarkable success in BrazilOver 85% of new cars sales are flex-fuel cars Through a special electronic sensor, the on-board computer recognizes the fuel type and mixture, and properly adjust the engine combustion parameters, without any interference from the driver • Introduced in the Brazilian market on March 2003 • Flex-fuel cars are designed to be fueled with gasoline, ethanol or any combination of gasoline & ethanol (currently from E25 to E100) • Seven brands and 49 models … and growing • 33,000 gas stations all over the country with at least one dedicated E100 pump
Ethanol is more than reality in BrazilMandatory blending and flex-fuel cars are boosting ethanol Despite the recent introduction, flex-fuel vehicles already account for more than 85% of new car sales in Brazil … … booming ethanol volumes in the country! Source: ANFAVEA
USA: largest ethanol market in the world Further potential for growth & opportunities New objectives for the U.S. Renewables • Pres. Bush (State of Union 2007): • Until 2017: replace 20% of the gasoline =132 • billion liters (AFS). • Energy Bill (June/2007): • Until 2025: 136 billion liters of renewable fuels
USA: largest ethanol market in the world Further potential for growth & opportunities • Restrictions to the corn production in U.S. should limit corn ethanol production to 60 or 65 billion liters a year. Cellulosic ethanol should generate another 15 to 20 billion liters, limited to the cellulose collect costs in the north hemisphere (between US$ 20 and 60 / ton) • Therefore, until 2025, the gap between the 136 billion liters target and the likely production of 85 billion liters should be imported … meaning roughly 50 billion liters per year in 2025 • Brazil would have, in this time horizon, conditions to prepare itself to participate in this market
A likely scenario is the U.S. Government to protect local ethanol producers, but considering the interests of ethanol importers, consumers and sectors affected by high prices of soybeans and corn (consumers of glucose and fructose, cattle, swine and poultry raisers). This scenario should imply the creation of an ethanol import quota Its reasonable to suppose that Brazil should have a big slice of this quota, anything from 25% to 40%. In case of a 50 billion liters quota, the Brazilian share should be of 12.5 or 20 billion liters This quota should keep the current CBI regime (Caribbean Basin Initiative) until the quota system is implemented. Assuming that the current ‘zero import duty’ for CBI dehydrated ethanol imports continues up to 2025, it would represent 9.5 billion liters of dehydrated ethanol (7% x 136), produced out of 10 billion liters of hydrous ethanol USA: largest ethanol market in the world Further potential for growth & opportunities Potential Market in the USA
Europe: strong lobby limits market potentialOpportunities shall be directed to own production and imports from poor countries Potential Market in Europe • The more likely scenario is that Europe would supply its own needs through local production and preferential tariff agreements with poor countries in the world : • “Everything But Arms” (EBA), allowing ethanol imports free of import duty from several poor countries in the world (Brazil not included) • “Sustainable Development & Governance” (SD&G), very similar to the EBA agreement (Brazil not included) • This means that Brazil would probably be able to export ethanol to Europe only to supply a marginal demand not fulfilled by Europe’s ex-colonies from Africa and Central America. This marginal demand would be limited from 3 to 4 billion liters • Although environmental growing consciousness may push ethanol consumption in some niche markets (for ex. Netherlands and Scandinavian countries)
Asia and Other Countries not so close Market potential still embryonic, but with some trade already in place Potential Market in Asia and in Other Places • Based on the Japanese fuel market of 60 billion liters a year, the theoretical ethanol potential is over 3 billion liter a year of consumption, therefore ongoing prospection continues towards Japan. • However, mixed signs appear to be driving Japan to adopted goals not so aggressive, such as the substitution of MTBE for the EBTE in volume of 7% to 20% of the gasoline. Therefore, the potential would be only of 352 million liters of ethanol per year • The largest potential market for Brazil in Asia is China, but the quantification of this market is still very doubtful • Other markets continue to appear on a random basis. Recently Petrobrás closed export deals with Venezuela and Nigeria of 1.4 and 1.2 billion liters per year respectively.
Is there a world market for ethanol? Yes, but adoption of ethanol is, before anything, a political decision!!! Conclusion: Potential Market in 2025 for Brazilian Ethanol • Industrial ethanol (Japan + Korea): 1.35 billion liters • Venezuela + Nigeria: 2.0 billion de liters • UE-27: probable residual market of 3 or 4 billion liters • CBI: 136 billion liters demanded x 7% x 50% = 4.76 billion liters • U.S., incl. CBI: (136-85) x 30% = 15.3 billion liters • Other markets (including Japan for fuel): total of 2.85 billion liters Total of 25 billion liters Potential Development for Brazilian Ethanol Exports (billion liters) Worst Case Best Case
Agenda • Introduction to Management • Brazilian Ethanol & the World Market • Cosan’s Enhanced Business Model • Fighting the Myths
Cosan: a quick introductionA History of Growth and Innovation … with scale, know-how and efficiency • 2012E • Greenfield & BrownfieldProjects (+10MM tons) • Cogeneration (1GW) Crushing Capacity (MM Tons) Mill Acquisitions • 2007 • CZZ $1.2Bn NYSE IPO • 10Y Bonds ($400MM) • 2005 • IPO ($400MM) • IFC loan • Alliance with Kuok Group 60.0 • 2008 • Vertical integration • 2006 • Perpetual Bonds ($450MM) • Ibovespa index 45.0 2004 Inaugural Bonds ($200MM) 40.0 40.0 38.8 • 2002 • Da Barra acquisition • 2000 • Cosan S.A. officially established • Alliance with Tereos and Sucden 1984-1994 Development of VHP sugar 31.5 30.3 • 1997-1999 • Partnership with Tate & Lyle • Santos port concession 1936 Foundation of Costa Pinto 19.1 15.6 9.5 7.5 4.0
Cosan: a quick introductionIntegrated platform provides flexibility … sugar, ethanol and electricity 60% Own Sugarcane 40% Growers Sugarcane Raw Sugar Production and Refinery at Origin Refinery at Destination Export & Trading Refined Sugar for the Local Market Crushing & Production Cogeneration Sale to the Grid Ethanol Sale in the Local Market Distribution at Destination Export Logistics Ethanol Production • Integrated platform represents an important competitive advantage for sugarcane crops vis-à-vis other feedstocks • Reduces risk of margin compression • Brings accurate information on crop development • Allows direct investments in R&D on major cost components • Enhances coordination between industry and agricultural department - 21 -
Cosan: a quick introductionOver 500.000 ha of land & crushing capacity of over 44 million tones of sugarcane 0.5MM tones Local 54M ha Own Land 3.2MM tones of Sugar 3.6 MM tones of TSR 300M ha Land Adm. by Cosan 24MM ton Own Sugarcane 2.7MM tones Export 246M ha Leased Land 6.4MM tones of TSR 44MM ton Total Sugarcane to Crush 1.2 Bi liters Local 1.6 Bi liters of ethanol 2.8 MM tones of TSR 250M ha Supplier’s Land 20MM ton Third Part. Sugarcane 0.4 Bi liters Export 250 MW 11.4MM tones of Bagasse 1.3 GW Future situation with investments in co-generation Assumptions: installed capacity of 44 million tones of sugarcane; 80 tons of sugarcane per hectare; TSR (total sugar recoverable) of 145kg per ton of sugarcane; 140 kg of sugar or 86 liters of ethanol per ton of sugarcane + 0.26 ton of bagasse per ton of sugarcane; 0.28 MWh per ton of bagasse
Cosan: leading global market position Top Ethanol and Sugar Producers The only Brazilian company within the largest players The Second Largest Global Ethanol Player… … and Second Largest Global Sugar Producer Ethanol Production in 2007 Sugar Production – in 2007 Total of 13.1 Bn Gallon Total of 159 MM Tons 830 (3) ADM VeraSun Aventine US BioEnergy Sudzucker (Germany) Tereos (France) Illovo (South Africa) Tate & Lyle (UK) British Sugar (UK) Abengoa Pacific Ethanol (1) CSR (Australia) Nordzucker (Germany) Danisco (Denmark) Bajaj (India) Source: Regulatory Filings, Equity Research Reports and Cosan Note: Marketed volume = own production + acquired from third-party Accounting for sugar under ethanol-equivalent basis. Cosan numbers are 2006/2007 Accounting for ethanol under sugar-equivalent basis - 23 -
Cosan: leading Brazilian market position Fragmented Industry in its early stage of Consolidation The Brazilian sugar and ethanol market is very fragmented. Cosan, the largest player, accounts for only 9.1% of the market … Consolidation in related sectors in Brazil Domestic Market Share Market Share of Top 5 Companies Sugarcane Crushed in 2006/2007 Oil 100.0% Oil 100.0% 9.1% Beer 97.0% Beer 97.0% Louis Dreyfus 2.5% Soybean 95.0% Soybean 95.0% Carlos Lyra 2.3% Steel(2) 93.0% Steel 93.0% Vale do Rosário 2.2% Orange Juice(2) 91.5% Orange Juice 91.5% São Martinho 2.2% Cement 80.0% Tércio Wanderley 2.1% Cement 80.0% Guarani 2.0% Dairy 77.4% Dairy 77.4% Zillo 2.0% Pulp 72.6% Oscar Figueiredo 1.9% Pulp 72.6% Others 71.1% Santa Terezinha 1.9% Santa Elisa 1.8% Paper 48.7% Ethanol & Sugar 17.8% Source: Unica and company reports
Major Changes demand major actions The Sugarcane Sector faced major disruptions Major Changes & Opportunities Depressed Short-Term Outlook • Countries, producers and newcomers rushed to “The El Dorado” through a messy production expansion and new projects • Global sugar production surplus, levered by subsidies & import restrictions, generated heavy inventories • Excess supply compressed sugar prices in the free market (2/3 are protected markets) • Ethanol production growing faster than new markets opening • Ongoing ethanol import barriers by developed countries • Misperception between “food & fuel” dilemma • WTO highest court ruled against European subsidized sugar exports (gap of 4-to-5 million tons in the free market) • Remarkable success of flex-fuel cars in Brazil (over 85% of new cars are flex-fuel after only two years since launch) • United States build the largest ethanol market in the world in merely two years … with further potential based on government targets • In Feb’08, fuel ethanol sold surpassed the amount of gasoline sold in Brazil • Potential energy shortages in Brazil in the near future invited bio-mass into the energy matrix A Changing Environment implies New Changes for the Companies!
Innovation to Face a Changing EnvironmentSelective actions shall imply in a broader Business Model COMMERCIALIZATION (Retail – da BARRA sugar) Local Distribution SUGAR & ETHANOL PRODUCTION Cosan S.A. Marketing Refining Crushing Plantation Production De-hydrating Trading • POWER • CO-GENERATION • (Ongoing Project) • LAND DEVELOPMENT • (Project Radar) • BROWNFIELD • (Gasa) Export Logistics • DEHYDRATION • PLANT • (Caribbean) • ETHANOLTRADING • (Vertical) • GREENFIELD • (Jataí Module) • SUGAR LOGISTICS • (Rumo) • EPCM • ENGINEERING • (Promon) • ETHANOL PIPELINE • (Uniduto) • FUEL DISTRIBUTION • (Esso)
36.8%(2) 38.1%(2) 5,800 5,200 4,200 3,800 Montevidiu Jataí April-07 July-07 1. Radar - Land Development ProjectLevering Land Expertise to keep Value Creation Inside Cosan The Best Tool for Land Procurement Profiting from Land Appreciation in the Future Potential Areas for Future Growth • Cosan manages 600.000 ha (largest BR agric. producer) • Leading edge in Geo processing Technology (GIS) Agricultural Potential maps Slope maps Rainfall maps Land Appreciation in Goiás Greenfields Area A01: MT A02: MT A03: MT A04: GO(S) A05: MS(S) A06: MS(C) A07: MG A08: CE; PB; RN A09: BA; PI; MG A10: TO; MA A11: TO; GO A12: GO(C) Source: FNP(1) Greenfield projects announced in Apr-07 by Cosan (2) In nominal R$
ENERGY MATRIX BRAZIL'07 OCDE'05 WORLD'05 BIOMASS 30.9 4.2 10.5 HYDRO & ELETRICITY 14.9 2.0 2.2 URANIUM 1.4 11.0 6.3 MINERAL COAL 6.1 20.4 25.3 NATURAL GAS 9.3 21.8 20.7 OIL & RELATED 37.4 40.6 35.0 TOTAL ENERGY 100.0 100.0 100.0 2. Co-generation of EnergyBrazil has a superior environment-friendly Energy Matrix Evolution of Energy Offer in Brazil Sugarcane as the 2nd Energy Source OTHER RENEWABLE TYPE OF ENERGY 2006 - % 2007 - % SUGARCANE & RELATED NON-RENEWABLE ENERGY 54.9 54.2 OIL & RELATED 37.7 37.4 VEGETAL COAL & WOOD NATURAL GAS 9.6 9.3 HYDRO & ELECTRICITY MINERAL COAL 6.0 6.1 NUCLEAR 1.6 1.4 NUCLEAR RENEWABLE ENERGY 45.1 45.8 MINERAL COAL NATURAL GAS HYDRO & ELETRICITY 14.8 14.9 VEGETAL COAL & WOOD 12.7 12.0 SUGARCANE & RELATED 14.6 15.7 30.9 OTHER RENEWABLE 3.0 3.2 BioMass OIL & RELATED TOTAL ENERGY 100.0 100.0 With an energy consumption in 2007 of 238,328 x 10 equivalent tons of oil, Brazil has built an environment friendly energy matrix, where sugarcane has become the 2nd energy source for the country (ethanol & cogeneration) 3
2. Co-generation of EnergyAdding a stable Cash Flow stream of over R$560M/yr to Cosan Energy Co-generation: Cosan’s Potential vs. Ongoing Commitments At 60MM tons crushing capacity, potential of 1.3 GW, with an incremental EBITDA of R$ 600MM 60MM tons 4.1 GWh R$ 3.5 bi 35.8MM tons 1.3 GW 2.4 GWh R$ 1.7 bi 0.5 GWh (spot market) 1.9 GWh (already sold) 740 MW R$ 560 MM R$ 350 MM CRUSHING COGEN INSTALLED SALEABLE EBITDA CAPACITY CAPEX POWER ENERGY CAPACITY Notes: - Estimates subject to changes - 1 MWh = 0.184 tons of CO2. Total of 754 tons of CO2/yr included in the EBITDA - Average days of 189 days per crop, with 83% of crushing time - Assumed bagasse and 50% of leaves, generating for 189 days (although additional bagasse/leaves could imply in 10 months of cogeneration)
3. Brownfield ExpansionsOver 10.0MM tons of Crushing Capacity at Attractive Multiples • Cosan has the capability to expand its crushing power by 10.6 million tons of cane (approximately 920 million liters of ethanol or 1.48 million tons of sugar). • Such expansion would imply in an estimated Capex of R$1.1 billion, or an interesting multiple of R$105/ton of crushing capacity. • Seeing independently, such Brownfield would be one of the top producers in Brazil. 2.8 0.5 0.3 Crushing starts this crop ’08/’09 2.0 1.9 0.5 50.6 1.0 1.6 40.0 Current Gasa Bonfim Univalem Destivale Mundial Junqueira Ipaussu Gasa II Future Capacity Capacity * Estimates; subject to changes
4. Greenfield ProjectCurrency appreciation mitigated by higher Crushing Output Project Profile Ethanol Output Timeframe (MM Liters) 370 1.100 • Integrated greenfield project, fully dedicated to ethanol • State-of-the-art technology, with efficient industrial facilities and lower production costs • Located in the State of Goiás, compound by 3 modules • Initial 10.0MM tons of crushing capacity enhanced to 12.0MM • Total estimated capex of R$ 1.4 billion (R$470 mm/ industrial module) • Jataí module coming on stream in 2009 370 370 311 200 50 Paraúna Mill Montividíu Mill Total Project Output FY 10 FY 11 FY 12 FY 13 Jataí Mill
5. EPCM Greenfield - PROMONLosses & Efficiencies Flows Revisited in a State of the Art Plant
6. Dehydration Plant Small base to penetrate the U.S. Market – CBI or Mexico Exports to the US – Direct • Anhydrous FOB Santos: U$2.09/gal • Sea Freight: U$0.2 • VAT (2.5%):U$0.05 • Tariff: U$0.54/gal • Final Price in the US: U$2.88/gal Exports to the US – through CBI • Hydrous FOB Santos: U$1.83/gal • Sea Freight (Brazil/CBI): U$0.15 • Dehydration Costs:U$0.30 • Sea Freight (CBI/USA): U$0.15 • VAT (2.5%):U$0.05 • Final Price in the US: U$2.48/gal In 2007, the Caribbean countries exported 0.3 billion gallons to the USA, i.e. 70% of their quota. Considering the USA renewable fuel standards, by 2022 the exporting potential from the CBI can reach 2.5 billion gallons Note: Ethanol price at NY harbour as of October 14th: U$1.90/gallon
7. Ethanol Trading: Vertical UK LLPCommercial Platform to boost International Sales of Ethanol • Acquisition of Vertical (50% stake) to • enhance Cosan’s commercial area • 53 people • (Brazil, USA, London & Geneva) • 123,540 m3 storage capacity • (Santos, Rotterdam, Antwerp & Texas City) • 981,043 m3 of ethanol sold in 2007 • (97.3 Africa; 170.4 Americas; 603.2 Europe; • 106.1 Far East; 1.5 Middle East & 2.5 Oceania) HIGHLIGHTS (US$ mm): 2007FY 2008FCST Volume (m3) 1.0 1.5 Sales 637 1,200 Gross Margin 13 45
8. Sugar Logistics – Rumo LogísticaThe largest Sugar Port in the world is born … and will grow further Teaçú Port Terminal (Nova América) COSAN Portuária • Static capacity of 170K tons • Annual shipment capacity of 4 million tons of grains • Highly automated operating processes (from the moment the truck leaves the mill until it reaches the port) • Loading Capacity of 40,000 metric ton per day • Largest sugar throughput port terminal in Brazil: 3.5M ton (23% of Brazilian exports) in 06/07 • Static capacity 200K ton + - Current loading capacity of 8.0M tons, and static capacity of 435K tons - R$119M investment made by Cosan to have 71.2% stake (28.8% Nova América) FURTHER GROWTH With a R$30MM investment post-integration, the port terminal will have 3 wharves and 5 ship loaders being the largest bulk terminal for agricultural products in the world, with total annual loading capacity of 17M tons
Storage Base ( Storage Base ( location location , , type type & & capacity capacity ) ) Distribution base Distribution base Pipes ( Pipes ( length length & diameter ) & diameter ) off off - - shore shore Monob Monob ó ó ia ia (exports (exports “ “ ” ” ) ) 9. Ethanol Pipeline – UnidutoCCC Consortium assures ethanol volume to the pipeline Ribeirão Ribeirão Preto Preto (road (road - - rail) rail) 155.000 m 155.000 m 3 3 235 km Ø Ø = 20 = 20 ” ” Output:11 bi liters Paul Paul í í nia nia (road (road - - rail) rail) 114 km 114 km 100.000 m 3 3 Ø Ø = 24 = 24 ” ” 127 km 127 km Output:16 bi liters Ø Ø = 30 = 30 ” ” Conchas Conchas (river - - rail) rail) São São Paulo Paulo Output:24.7 bi liters 155.000 m 155.000 m 3 3 106 km 106 km Campinas Campinas Ø Ø = 24 = 24 ” ” Output:14.2 bi liters 36 km 36 km Ø Ø = 16 = 16 ” ” Santos Santos - - CING CING (road) (road) 220.000 m 220.000 m 3 3 Taboão Taboão da da Serra Serra (road) (road) Juquiratiba Juquiratiba (rail) (rail) 170.000 m 170.000 m 3 3 20.000 m 20.000 m 3 3 Serra Serra do Mar do Mar • Creation of Uniduto Logística S.A., a JV among Cosan, Copersucar and Crystalsev • Uniduto to develop, construct and operate an ethanol pipeline network linking the port terminal on the • coast of Santos, SP, and the city of Paulínia, with arms to the cities of Conchas & Ribeirão Preto • The ethanol pipeline shall reduce logistics costs by 35% to 40% (from R$95/m3 to R$57/m3, RP region)
10. Esso – Fuel DistributionAcquisition brings unique base on Fuel Marketing, Lubes and Distribution
Cosan valuation thru CSAN3/CZZ share priceA fraction of Replacement Cost – a unique opportunity! Cosan Replacement Cost Calculation (Without Esso) – Fx Rate:US$2.0 Share Price CSAN3 @ Bovespa R$ 10.55 CZZ @ NYSE US$ 2.68 A Bargain !!!
Agenda • Introduction to Management • Brazilian Ethanol & the World Market • Cosan’s Enhanced Business Model • Fighting the Myths
Myths vs. FactsGet the Facts Right and Forget the Myths Ethanol is leading to a general deforesting in the world Ethanol Use Cause More Damage to the Environment than Fossil Fuels Ethanol Production Consumes More Energy Than it Generates Brazil is being overrun by sugarcane in detriment of food production If Biofuels are viable, they are only in certain niches (such as Brazil) Given the ongoing debate on ethanol benefits, it is important to distinguish false myths from real facts
Myth #1Brazilian Sugarcane Ethanol leads to the Amazon Rainforest deforesting Where is the Sugarcane? 2,000 Km Amazon Rainforest RN PB PE AL SE MT GO 2,500 Km MG MS Sugarcane SP PR Hectares Acres Myth vs. Fact • In terms of general deforesting, let’s concentrate on the Amazon Rainforest because there are no forests in the USA to be destroyed. • The vast majority of the Brazilian sugarcane (approximately 90%) is harvested in the Center-South region, which is located over 2,500 km from the Amazon. That is roughly the distance between NY City and Dallas, or between Paris and Moscow. • The remaining 10% is grown in the North-East region of Brazil, about the same distance from the Amazon’s eastern border. • In addition, the Amazon region does not offer favorable conditions for sugarcane production and for this reason, future expansion is anticipated to continue in the Center-South region of Brazil. • At the main sugarcane cluster in the world, i.e. São Paulo state, the sugarcane increase is occurring over the cattle land. Cattle land in São Paulo had an average of 1.2 heads/hectare (in Brazil, the average is even lower). Now this ratio has increased to 1.4 heads/hectare. Some environmentalists argue that the cattle are being pushed towards the forest. No, in reality the cattle density is being increased! Source: NIPE – Unicamp, IBGE and CTC Brazil …………………………… 850.0 2,100 Potential arable land …………. 320.0 790 Potential land for agriculture … 90.0 222 Cultivated land ………………... 60.4 149 - Out of which Sugarcane …. 7.9 19
Myth #2Ethanol use cause more damage to the Environment than fossil fuels Myth vs. Fact Emissions Avoided with Ethanol Replacing Gasoline • Ethanol can be produced from a wide variety of feedstock, with different environmental impacts depending on how they are processed. • Brazilian ethanol produced from sugarcane reduces greenhouse gas emissions by up to 90% compared to gasoline, a reduction unmatched by any other biofuel produced with existing technology. • In fact, when compared to crops such as corn or soybeans, sugarcane captures more carbon because it is a unique semi-perennial crop only replanted every six years. • The use of degraded pastures – the expansion area of choice for sugarcane in Brazil – actually generates a carbon credit, as sugarcane captures significantly larger amounts of carbon than the quantities originally stocked in this type of land. Source: IEA – International Energy Agency (May, 2004), based on a review of recent articles. Future Improvements % Mechanization Avoided emissions 80% 280 70% 255 60% 230 50% 205 % Mecanization MM ton CO2 40% 180 30% 155 20% 130 10% 105 0% 80 2007/2008 2011/2012
Myth #3Ethanol Production consumes more Energy than it generates Myth vs. Fact Energy Efficiency of Selected Feedstocks • When the entire process is considered, from the planting of sugarcane to the use of ethanol as a motor vehicle fuel, sugarcane ethanol produces 9.3 units of clean, renewable fuel for every unit of fossil energy utilized. Ethanol produced from other feedstock's such as sugar beet, cereals and grains (corn, wheat, barley etc), manages a 2-to-1 ratio today. • In addition, the by-products of sugarcane ethanol production (bagasse and in the future leaves) are used to produce clean, renewable electricity. Sugarcane is 5x to 6x more efficient than other feedstocks Source: Inter-American Development Bank
Myth #4Brazil is being overrun by Sugarcane in detriment of Food Production Myth vs. Fact Agricultural Land used in Brazil • Sugarcane for ethanol production in Brazil occupies 4.7 million hectares, or roughly 1.5% of the country’s 320 million hectares of arable farmland. The cultivated area is 1/2 of that dedicated to corn, 1/4 of the area planted with soybeans and 1/60 of the land used for cattle farming. • With roughly 1.5% of its arable land dedicated to sugarcane for ethanol production, Brazil has been able to replace half of its gasoline needs with sugarcane ethanol. While cane production has increased steadily in recent years, food production in Brazil has grown dramatically without any material price increases. • The 2007 grain and oilseed harvest set a record at 142 million metric tons, a doubling of production in the last ten years. Brazil is widely recognized for its diversified and highly efficient agricultural sector – it is the world’s leading exporter of beef, coffee, orange juice, poultry, soybeans and sugar. • A variance of this myth is the one that correlates the biofuel production to the hunger in the world. In fact, the poor people are having a bit better conditions to eat a little. Besides that, the area dedicated to biofuel production in the world is 10 million ha, while the area used for agricultural purposes in the world is 1.2 billion ha. Critics lost completely their sense of proportion. They are thinking that the sugarcane plantation in Brazil and the corn in the USA, which is growing, are disturbing the whole system. Simply, this is not possible. Hectares % Soybeans ……………………..…… 21.3 34.9% Corn ………………………………… 14.4 23.7% Sugarcane …………………………. 7.9 13.0% - being 60% to Ethanol ……..…. 4.8 7.8% Beans ………………....................... 3.8 6.3% Rice…………………………………. 2.8 4.7% Coffee………………………………. 2.2 3.7% Others …………………………...….8.4 13.7% Total………………………………… 60.8 100%
Myth #5If Biofuels are viable, they are only in certain niches, such as Brazil Myth vs. Fact • In this last myth, finally the critics acknowledge that sugarcane ethanol produces a cleaner fuel and blá, blá, blá … then they say “well, this is only in Brazil which is just a niche, and is has 10 times less cars than in the USA. Therefore, even if you guys solve the problem there, you will not solve the problem in the world!”. • Well, Brazil produces only part of the world’s sugarcane. There is sugarcane all over Central America, in India, Thailand, South Africa, Australia, etc. Other areas in the world could be explored, including the African continent, in order to improve life conditions to people in those locations (Poverty-Environment-Renewable Energy). But then, these same critics continue to say “ah, this is interesting. But when you produce ethanol in Brazil, you have slave work and you burn sugarcane fields to cut them”. • Well, during the harvest period Cosan has more than 40,000 employees, all of them with signed ID from the Labor & Work Minister, according to the local labor law. Moreover, São Paulo state is responsible for 2/3 of the Brazilian sugarcane production, and has nowadays almost 50% of the sugarcane harvest done by mechanical harvesters. According to the state law, by 2014 all the manual cut, which requires the burning of the sugarcane fields, will be extinguished in the state. And usually the other states in Brazil tend to follow the leadership of São Paulo state In summary, what we need is some effort from people with minimum knowledge and common sense, in order to clarify these myths … therefore, may I invite you, in this room, to do so in the future. Thank you!
Renewable Energy for a Better World Ethanol | Sugar | Cogeneration Which ethanol producer/renewable energy player should you bet? Thank you !