Download

1 / 25
250 likes | 400 Views
Dealing with Data. 7 th grade math. What is data?. Data is information. Raw data can come in many different forms, the two most common are: Categorical data – data with specific labels or names for categories (usually in word form)

E N D
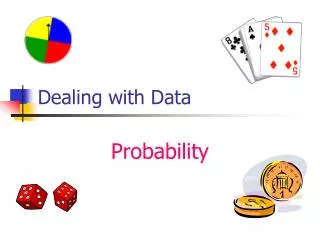
Dealing with Data 7th grade math
What is data? • Data is information. • Raw data can come in many different forms, the two most common are: • Categorical data – data with specific labels or names for categories (usually in word form) • Numerical data – data that are counts or measures (usually in number form)
Variability • Variability – indicates how widely spread or closely clustered data values are • Students collect data on the amount of change in the pocket of every student at NHM. (Clustered or spread?) • Students survey current students at NHM to find out their grade level – 6th,7th, or 8th. (Clustered or spread?)
How do you display data? • The easiest way to display data is in a graph or chart. • Pictograph Circle Graph • Histogram Line Plot • Bar Graph Scatter Plot • Line Graph Box-and-Whisker Plot • Frequency Distribution • Stem and Leaf Plot
What makes a good graph? • A good graph… • Fits the data you have collected. • Has a title and labels. • Accurately displays your data. • Allows a reader to easily draw conclusions. • Catches the reader’s attention. • Is easy to read and understand.
Where does data come from? • ???? • Surveys • Studies • Questionnaires • Census data
Populations, Samples, and Statistics • Population – the entire set of items from which data can be selected (ex. Every 7th grade student, every girl at NHM) • If we collected data from EVERY member of a population we would refer to this as a census. • Collecting data from an entire population can be a long and difficult process, but the data obtained would be extremely accurate and reliable.
Populations, Samples, and Statistics • Sample – a selected group of a population that is representative of the entire population. (ex. Twenty 7th grade students in Mr. Ridley’s math class) • Samples can be: • Random – data is obtained from random members of a population • Systematic – data is obtained using a system for selection (ex. Every 10th person) • Convenient – data is obtained from the easiest source available within your population (ex. People who sit next to you in class)
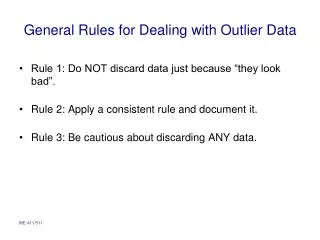
Populations, Samples, and Statistics • Anytime you obtain data about a measured characteristic of your sample, you have collected a statistic. • If you obtain data about a measured characteristic of an entire population, you have collected a parameter. • If you find a data point that is not consistent with your other results (way too high, way too low) we call it an outlier and it can be removed. • Which data would be more reliable?
Interpreting Data • Raw data does not come in a user-friendly format. • It must be processed and presented in a form that is easy to read and understand. • One system for doing this is graphing, which allows for a visual picture of a data set.
Measures of Central Tendency • Another system for interpreting data are the measures of central tendency. • Also called measures of center, these numbers attempt to summarize a data set by describing the overall clustering of data in a set • The goal of these numbers is to find one single numerical value that can represent the “average” value found in the entire set.
Measures of Central Tendency • The 3 most common measures are: • Mean – the average, found by dividing the sum of all the numbers in a data set by the number of pieces of data you collected. • Median – the middle value, found by locating the middle number in a ordered data set • Mode – the most common value, found by locating the most frequently appearing value in a data set
Tricks of the Trade • Median – the cross out method • Order your data set from least to greatest • Repeatedly cross out the smallest and largest value in your data set until you arrive at the median • If you have two values left, add them together and divide by two. • Mode – it’s the “MOST” • Both four letter words • Both begin with MO
Tricks of the Trade • Mean – sorry =( • I really am sorry, but you just have to do the math. • Add them up, divide by the number of pieces of data in your set.
Practice • Its almost report card time and Sam is worried about his grade. He has made the following scores on his 7 tests in math: 77, 84, 83, 78, 92, 90, 84. Help Sam out by finding his … • Mean • Median • Mode
Practice • Sam’s football coach told him he was going to be benched if his grade was below a “B”, should Sam be worried? Explain. • Which measure of central tendency would give Sam the best grade possible? • Which measure of central tendency best reflects Sam’s actual test performance? • Are there any outliers in his test scores?
Practice – On your own • A statistician randomly selected 12 7th grade students and asked them how much time they spend each night on homework. The responses were: • 0 mins 20 mins 15 mins • 1 hour 30 mins 45 mins • 15 mins 0 mins 15 mins • 30 mins 1 hour 1 hr & 10 mins
Practice – On your own • What is the average amount of time these students spent on homework? • Explain how you determined your answer. • Does your answer reflect the mean, the median, or the mode? Explain how you know. • If you had found a different measure of central tendency, would you expect your answer to be the same or different? Explain. • If a 7th grader spends 15 hours per day at home, what percent of home time does the “average” student spend on homework?
Measures of Variability • Attempt to describe the clustering seen in a set of numbers. • The two most common measures of variability are: • Range (easy) • Interquartile Range (complicated) • Range is used quite often, interquartile range is really only seen when creating a box-and-whisker plot
Range • Range is quite simply the difference between the largest value and smallest value in a numerical data set. • Code word: difference = subtraction • EX. 12, 15, 19, 21, 41, 67 • The range is the largest value (67) minus the smallest value (12), which equals 55.
Interquartile Range • Yes, it is as complicated as it sounds. • First, what is a quartile? • Think quad, which means four. • Ok, so 4 of what? • Quartile refers to one of 3 numbers that can break a set of data into 4 even sections. • Quartile – a number that creates 4 equal sections of numbers in a distribution
Interquartile Range • Lets see these quartiles in action! • Step 1: Put a set of numbers in order • 13, 15, 16, 18, 22, 25, 26 • Step 2: Find the median • 13, 15, 16, 18, 22, 25, 26 • This separates the data into two sections, exclude the median • [13, 15, 16] 18 [22, 25, 26] • The median is now called the Second Quartile or Q2.
Interquartile Range • Step 3: Find the median of the set of numbers less than Q2. • [13, 15, 16] 18, 22, 25, 26 • 13, 15, 16 • This number is now called the First Quartile or Q1. • Step 4: Find the median of the set of numbers greater than Q2. • 13, 15, 16, 18, [22, 25, 26] • 22, 25, 26 • This number is now called the Third Quartile or Q3.
Interquartile Range • Step 5: Find the distance between the Third Quartile and the First Quartile • (Q3 – Q1) • 13, 15, 16, 18, 22, 25, 26 Q1 Q2 Q3 (25 – 15) = 10 This value is the interquartile range!
Interquartile Range • So why did we do all of that work? • What does a range tell us? • All values fall between the smallest and largest value……..well duh!!! • What does the interquartile range tell us? • Half (50%) of all values fall between the first and third quartile. • The interquartile range reflects the real “heart” of the data set.