Download
1 / 22
220 likes | 417 Views
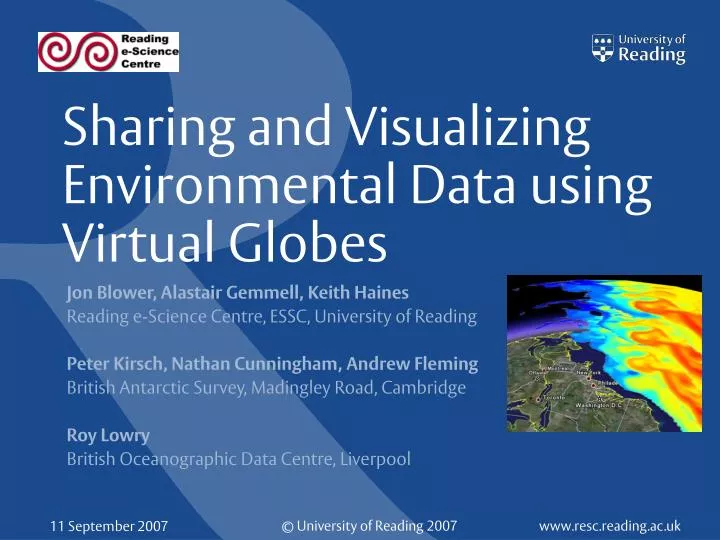
Sharing and Visualizing Environmental Data using Virtual Globes. Jon Blower, Alastair Gemmell, Keith Haines Reading e-Science Centre, ESSC, University of Reading Peter Kirsch, Nathan Cunningham, Andrew Fleming British Antarctic Survey, Madingley Road, Cambridge Roy Lowry

E N D
Sharing and Visualizing Environmental Data using Virtual Globes Jon Blower, Alastair Gemmell, Keith Haines Reading e-Science Centre, ESSC, University of Reading Peter Kirsch, Nathan Cunningham, Andrew Fleming British Antarctic Survey, Madingley Road, Cambridge Roy Lowry British Oceanographic Data Centre, Liverpool
E-Science: Connected science • We need to be able to connect data across the environmental sciences (right) • Visualization is very important • But complicated by plethora of file formats and tools • Geographic Information Systems (GIS) often complex and vendor-specific • Environmental science data are four-dimensional • GIS historically focussed on land surface
How important is visualization? • (Microsoft case study with BP: Hurricane Management System) • "This solution is changing the way we do business. When the data is presented through a map-based interface, it’s amazing. It gives you a richer, bigger, more intelligent picture of what’s going on. " – Steve Fortune, BP • http://www.microsoft.com/casestudies/casestudy.aspx?casestudyid=201427
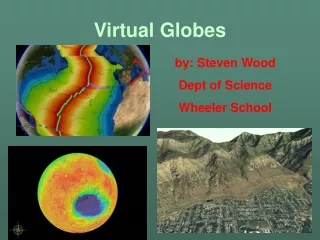
ArcGIS Explorer NASA World Wind Google Earth Microsoft Virtual Earth FreeEarth The Virtual Solar System • > 30 Virtual Globes currently available!
Combining data on a Virtual Globe:Hurricane Katrina, August 2005 • Storm track positions (analysed from ECMWF vorticity data) by Lizzie Froude, ESSC • Sea surface temperature data from UK Met Office FOAM model • Combination shows cooling of surface waters on right-hand side of cyclonic storm track • High winds cause upwelling of cool, deep water
Keyhole Markup Language (KML) • KML encodes simple geographic features in XML • "Points, lines and polygons" • Image overlays • <description> field can hold HTML with links, images etc • Contains several types of information: • Geolocation • Style • Camera control
UK Met Office ocean forecasts http://lovejoy.nerc-essc.ac.uk:8080/ncWMS/godiva2.html NERC Centre for Air-Sea Interactions and FluXes http://www.research.plymouth.ac.uk/casix/ Weather data and storm tracks http://www.gearthblog.com/blog/archives/2007/06/weather_and_storm_tr.html Some currently-availableenvironmental datasets in KML format
Virtual Globes as Discovery andBrowse tools • BODC uses Google Earth as spatial metadata browsing tool for in-situ measurements • Can easily check for errors • E.g. ocean data located on land • Misplaced component of linear ship track • Displays “light” metadata, with links to more sophisticated information • Developed in under a week!
Real-time data visualization • British Antarctic Survey (BAS) used KML data feeds to support 2 scientific cruises in 2006 • Multiple data streams (ship location, sea temp and salinity, air temp and pressure) streamed to Google Earth in near real time • Enabled real-time decision-making (e.g. tracking of predators, left) • Saved ship time, hence £££ King penguin track overlain with concurrent chlorophyll and satellite imagery
Beyond visualization:Extending the capabilities of VGs • Approach 1: Extend the client • Only possible if VG exposes an API or is open source • ArcGIS Explorer (.NET API) • NASA WorldWind (Java API, Open Source) • Approach 2: Do processing on a server • Expose results as KML via a Web Service • Can use web interface to control the Web Service • Useful for closed-source systems (e.g. Google Earth)
Example: ocean data assimilation • Scientists need to compare ocean models and observations • A Web Service performs comparison, then outputs results in KML • Red dots show bad model-obs fits, green dots are good fits • Clicking on an observation brings up more information • Driving real improvements in the model http://www.nerc-essc.ac.uk/~alg/OceanDIVA.html
Virtual Globes: pros and cons • Pros: • Easy to use • Easy data formats • Compelling visualizations • Cons: • Generally no data analysis functions • Vertical and temporal dimensions not always handled properly (left) • Patchy support for OGC Web Services • (But products vary widely) Vertical structure of Gulf Stream shown above sea level in Google Earth
What is the best scientific use for VGs? Have an idea Discuss/explore Do the work Publish Virtual Globes MATLAB, IDL etc
Alternatives to Virtual Globes: WebGIS • Lots of systems now available for displaying geographic data on the Web • Google/Yahoo Maps • Microsoft Virtual Earth • OpenLayers • FreeEarth • WorldKit • Usually based on Javascript API • Usually read imagery from map tile services • Can often overlay simple features (KML, GeoRSS) ICEDS (UCL) Godiva2 (ReSC)
Did Hurricane Felix cause the seasurface to cool? • Storm track from www.hurricane-tracking.co.uk • Sea surface temperature from OSTIA (analysed satellite product), UK Met Office • Little visible evidence of cooling. • Why different behaviour from Katrina? http://gearthblog.com/blog/archives/2006/07/weather_and_sto.html http://lovejoy.nerc-essc.ac.uk:8080/ncWMS/godiva2.html?dataset=OSTIA&variable=analysed_sst http://ghrsst-pp.metoffice.com/pages/latest_analysis/ostia.html
ProfileFeature GridFeature Beyond KML:Geography Markup Language (GML) ProfileSeriesFeature • KML ≈ GML v2 (simple features) • GML v3 adds much more sophistication (complex features) • Communities create profiles of GML ("Application Schema") • Describes features of interest • NERC Data Grid created CSML • Climate Science Markup Language Thanks to Andrew Woolf (STFC and NDG)
Web Feature Service Web Coverage Service Web Map Service Features (GML) Gridded data (NetCDF, GeoTIFF) Map imagery (PNG, JPG, GIF) Open Geospatial Web Services • Open Geospatial Consortium publishes open standards for geospatial Web Services: (plus many more!)
Importance of sharing geospatial data • "Approximately 80% of business and government information has some reference to location, but until recently the power of geographic or spatial information and location has been underutilized as a vital resource for improving economic productivity, decision-making, and delivery of services" – OGC vision • EU INSPIRE directive mandates that all public bodies must provide: • Discovery services • View services • Download services
What I haven't discussed • Security • Need solution based on simple HTTP GET • Licensing • Public outreach
Summary • Virtual Globes allow easy simultaneous visualization of lots of types of environmental data • Well-suited to "exploratory" phases of scientific work • Good way for data providers to advertise their wares • KML is simple but limited way of encoding data • It's a visualization format really • GML should be used to encode data for true interoperability • But needs concerted community effort to define feature types • Simple interfaces are good! • "scriptability" enables mashups
Also see … • Reading e-Science Centre booth • Satoshi Sekiguchi, "GEO Grid" • Keynote, Tuesday 09:45 • Tim Foresman, "Digital Earth: The New Digital Commons" • Keynote, Wednesday 15:00 • Gen-Tao Chiang, "Driving Google Earth from Fortran" • Session 2.2, Tuesday 15:10 • Gobe Hobona, "Workflow enactment of grid-enabled geospatial Web Services" • Session 3.4, Wednesday 11:25 • Geolinking demo, White Rose Grid • Demo session, Wednesday 14:30 • E-Science Highlights, Issue 2 (in your delegate pack!)