Download
1 / 44
440 likes | 607 Views
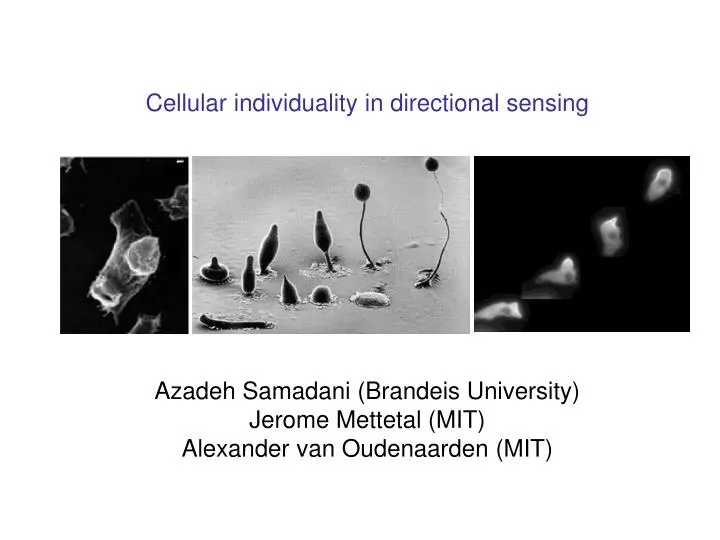
Cellular individuality in directional sensing Azadeh Samadani (Brandeis University) Jerome Mettetal (MIT) Alexander van Oudenaarden (MIT). How do cells make a decision?. A cell makes many decisions based on the cues from the external environment. absence of a gradient.

E N D
Cellular individuality in directional sensing Azadeh Samadani (Brandeis University) Jerome Mettetal (MIT) Alexander van Oudenaarden (MIT)
How do cells make a decision? A cell makes many decisions based on the cues from the external environment absence of a gradient presence of a gradient cue-dependent symmetry breaking random symmetry breaking How does the decision making vary from cell-to-cell?
How do cells make a decision? Bacteria (Prokaryote) White blood cell (Eukaryote) This movie is made by David Rogers. Taken from website of Tom Stossel. Movie by Nikhil Mittal & Elena Budrene
Presence of chemical attractant Absence of chemical attractant Temporal gradient sensing
Bacteria vs. Amoebae Slime mold amoeba E. coli 2 mm 20 mm • Bacteria (Prokaryote): Small • Small compare to diffusion length • Sample over time • Biased random walk towards the food • Amoebae (Eukaryote): Large • Larger cells • Sample the periphery of the cell • Directed motion towards the food
Objectives and long term goals: • By quantitatively exploring cue-dependent cell polarization, we • will better understand the molecular mechanism of directed cell • motility (chemotaxis) • 2. By understanding stochastic cellular behavior, we will improve our understanding of non-genetic individuality and its impact on the fitness of a population Focus on ‘well characterized' biochemical networks in a ‘simple’ organism: The model system: Dictyostelium (social amoeba)
A model system: Dictyostelium (social amoeba) An experimental model system for eukaryotic chemotaxis 1 mm 10 mm 60X real speed cAMP source
Actin PTEN PI3K PIP3 Ph GFP P P P P P A well characterized biochemical networks outside cAMP Cell membrane receptor PIP2 Cytosol GFP indicates where the leading edge of a cell would be if the cell is able to move
Receptor distribution is uniform around cell membrane Movie taken from P. Devreotes website Therefore asymmetric signaling must occur downstream of the receptors
PH-CRAC-GFP is a convenient reporter of the leading edge of a cell, even when cells are immobile +LatA C. Parent and P. Devreotes. Science, 95 (1999) In a gradient, PH-CRAC-GFP accumulates to the leading edge of a cell Gradient sensing can be separated from the movement CRAC: Cytosolic Regulator of Adenylyl Cyclase
A different technology: UV induced uncaging of cAMP Caged cAMP-inactive flow Active cAMP UV (360 nm) cleaves this bond UV exposure area • Main advantages: • allows well defined cAMP pulses • pulses are reproducable
spatio-temporal cAMP concentration DcAMP ~ Dfluorescein = 3.0 x 10⁻⁶ cm2/s
Response of a single cell to a pulse raw data total time = 30 sec Rcell = 5 mm signal difference with respect to unstimulated cell Response of the cell is polarized towards the direction of the pulse
Response of a single cell to a pulse x x signal difference with respect to unstimulated cell quantifying GFP concentration Along cell membrane Maximum of the response ~ 8 seconds
Response of a single cell to a pulse response function maximum of the response ~ 8 seconds
A single cell responds reproducibly to multiple pulses 10 repeated stimulation for three single cells Psin(f) Pcos(f)
f P The response function can be characterized with 3 parameters 1) Localizationmean of the response function 2) Polarizationamplitude of the response function 3) Polarization angledirection of the maximum response
A single cell responds reproducibly to multiple pulses 10 repeated stimulation of the same cell polar plot of the polarization vector pulse P the error bars denote standard deviations the pulses are separated by 2 minutes
Response to the same pulse vary significantly from cell-to-cell Single cell vs. Population pulse <Px> = (6 ± 0.4) % Single cell - 10 pulses 100 cells - 1 pulse
The population correctly detects the pulse direction more cells polarize in the direction of the pulse f = 0
The magnitudes of L and P correlate with f “Right cells” (f = 0) larger localization; stronger polarization “wrong” cells (f = 180) smaller localization; weaker polarization
R cell r = 5 mm Can we reduce the noise by increasing the signal? If the bound state of the receptor t ~ (1- 2 sec) D (of cAMP) = 10-6 cm2/s R ~ (D t)1/2 = 10-3 cm ~ 10 mm There are between 5x10⁴ to 105 receptors/cell In the sampling volume there are: C molecules molecule/receptor Noise/signal 10-10 M 6x 10² 0.01 cells do not respond 10-9 M 6 x 10³ 0.1 1% 10-8 M 6 x 10⁴ 1 0.5% 10-7 M 6 X 10⁵ 10 0.1% 10-6 M 6 X 10⁶ 100 0.01%
The noise in directional sensing does not decrease by increasing the external concentration The origin of symmetry breaking must be interacellular
Summary of the main experimental observations • The response of a single cell is reproducible from pulse-to-pulse • The response of cells within population vary greatly from cell -to-cell • On average the population finds the correct direction of the pulse • Individual cells polarizing in the right direction have about two-folds larger localization and polarization than cells that polarization in the wrong direction • The origin of the noise must be intaracellular How can we explain the variability?
Models Local excitation and global inhibition of the signal Activator Inhibitor Diffuses rapidly Global (front, back and sides) Diffuses slowly Local (leading edge) • Diffusion-Translocation, Postma, van Haastert, Biophys. J. (2001) • Receptor-Regulated phospholipid dynamics, Narang, Subramanian and Laufenberger, Annals of Biomed. Eng. (2001) • Inhibitor-Diffusion, Rappel, Thomas, Levine and Loomis, Biophys. J. (2002) • Local excitation- Global Inhibition, Iglesias and Levchenco, Biophys. J. (2002)
Activator Inhibitor Mechanism: Local Excitation-Global Inhibition cell Is this a good model?
Local Excitation-Global Inhibition Model (LEGI) Activator Equations Iglesias and Levchenco (2002) S R* Ainactive Iinactive I A R Local Activator
S R* Ainactive Iinactive I A R Local Excitation-Global Inhibition Model (LEGI): Inhibitor Equations Iglesias and Levchenco (2002) diffusion Global Inhibitor
Local Excitation-Global Inhibition Model Iglesias and Levchenco (2002) S ka ki R* kr k-r I A R ActivatorSlow diffusion Inhibitor Fast diffusion
Localization dynamics can be reproduced by the LEGI model LEGI model fits the average and the dynamics of the localization fairly well LEGI predicts a smaller polarization than observed experimentally
Problems with the LEGI models The model reproduce the average and dynamics of localization (not polarization) fairly well. Every single cell (according to the model) will polarize in the direction of the external gradient There is no allowance for stocasticity in the LEGI model What can we do to improve on LEGI models?
pulse-to-pulse variability of a single cell cell-to-cell variability of a population ! The error bars denote standard deviations, which increase 5 fold from single cell to population
The geometric Model Proposal: internal (static) external (dynamic) polar coordinates ~ Px ~ Py What happens in the case of a uniform external stimulation? S1 = 0
First order prediction of the geometric model Geometric model allows for symmetry breaking even in the case of uniform stimulation
A uniform external stimulation S1 = 0 The distribution of polarizations are uniform as predicted by the geometric model
A directed pulse The distribution of polarizations are shifted toward the direction of the external pulse
Proposed Experiments: Moving the external source around the cell internal signal (static) external signal (dynamic)
Geometric model fits the data with only two fitting parameters a = eS0/S1 and fe measured response angle Large e (>> S1/S0) the Seff stays in the direction of the internal signal ignoring the extracellular signal (ffe) small e (<< S1/S0) Seff will follow the extracellular signal exactly(fqs) Intermediate e (~ S1/S0)
Geometric model can quantitatively predicts the fraction of cells that polarize in a specific direction Using measured average value of a from our population measurements geometric model quantitatively predicts the relation between mean localization and polarization, with the polarization angle
Summary • The response of a single cell is highly reproducible from pulse-to-pulse • In contrast, a large variability is observed from cell-to-cell • Geometric model successfully predicts the observed variability • This observed variability is the results of variation in the spatial localizations of the proteins inside a cell and cannot be explain only by the fluctuations in the number of signaling molecules from cell-to-cell
v = 10 um/s 6 min 1 mM Other interesting questions: • Single dictyostelium cells communicate with each other through pulses of cAMP • Cells demonstrate rectified motion in response to traveling pulses of cAMP 1- Why do cells show rectified motion? 2- How does the response of cells vary as a function of pulse frequency? 3- how do cells respond to periodic vs. chaotic or aperiodic stimuli? 4- How does the chemotactic response vary by changing the adaptation time? Sam Rauhala Mike Desantis Department of Physics Brandeis University Dark field waves of Dictyostelium cells (Lee, Goldstein and Cox)
syringe pump flow computer controlled actuator Experimental set up: Making cAMP waves with different frequencies Jay Mettetal (MIT), Mike DeSantis and Samuel Rauhal (senior thesis at Brandeis)
Chemotaxis toward pulses of cAMP 1sec pulse every min. Flow 350 mm ~ 20 pulses Cell tracks as a function of wave frequency Dt = 7 sec 15 sec 30 sec 60 sec 120 sec 240 sec
Preliminary results with tracking motile cells shows that: Maximum response occurs at T = 30 s 1 – At least within a certain range of frequencies, time varying stimuli are more efficient than continuous stimuli 2- Maximum response occurs for T = 30 sec Linear-steady gradient seconds Wild type dictyostelium cells produces pulses with period of 6 min