Download
1 / 21
220 likes | 230 Views
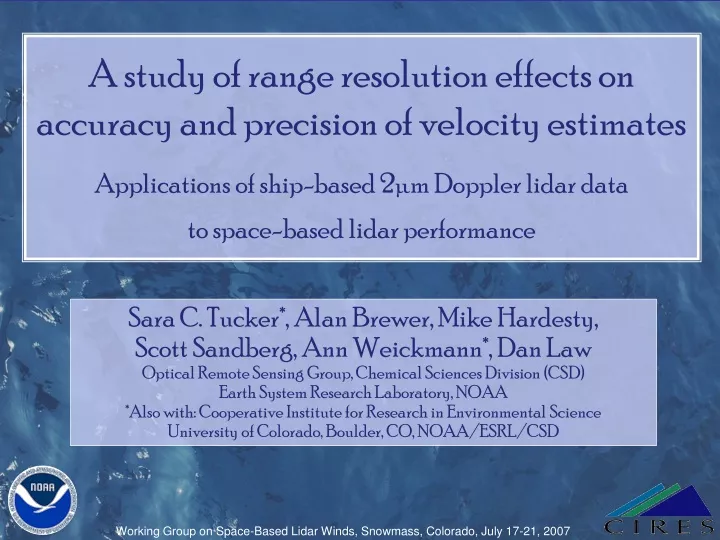
A study of range resolution effects on accuracy and precision of velocity estimates Applications of ship-based 2 µm Doppler lidar data to space-based lidar performance. Sara C. Tucker*, Alan Brewer, Mike Hardesty, Scott Sandberg, Ann Weickmann*, Dan Law

E N D
A study of range resolution effects on accuracy and precision of velocity estimates Applications of ship-based 2µm Doppler lidar datato space-based lidar performance Sara C. Tucker*, Alan Brewer, Mike Hardesty, Scott Sandberg, Ann Weickmann*, Dan Law Optical Remote Sensing Group, Chemical Sciences Division (CSD) Earth System Research Laboratory, NOAA *Also with: Cooperative Institute for Research in Environmental Science University of Colorado, Boulder, CO, NOAA/ESRL/CSD Working Group on Space-Based Lidar Winds, Snowmass, Colorado, July 17-21, 2007
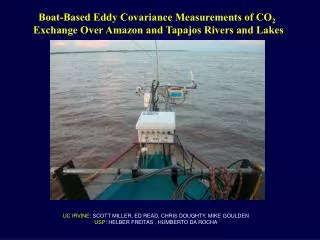
HRDL Winds Characterizations of the Gulf of Mexico and Galveston Bay • Winds and turbulence information: used to determine the potential performance, including errors, based on sample rate/volumes, etc, in space-based Doppler lidar measurements. • Cloud coverage: used to determine the percentage of time a satellite can make measurements at each altitude in this area. • Aerosol measurements: used to determine the expected levels of return signal available in this region • Closure in aerosol studies at 355 nm using ozone profiling lidar (OPAL), cavity ring-down, and in-situ instruments. Will attempt to scale the backscatter and extinction numbers to HRDL wavelength for comparison studies. • Comparisons withCALIPSO and HSRL
HRDL wind and aerosol products for understanding Marine Boundary Layers • Composite products • Horizontal mean wind profiles • Profiles of relative aerosol strength and aerosol layering • Vertical winds and vertical mixing/turbulence statistics • Horizontal (near surface) mixing/turbulence statistics • Aerosol and mixed layer (i.e. Boundary layer) heights • Wind speed and directional shear profiles • Individual Scan Products • Boundary layer dynamic features: rolls, surface streaks, thunderstorm outflows, etc • Ship/oil-platform plume detection
Objective: To study the effect of variability in the small-scale wind fields, and mean wind shear, on expected performance. • Reprocess NOAA’s High Resolution Doppler Lidar (HRDL) TexAQS 2006 measurements with 500m range gates and then, • look at accuracy and precision of velocity estimates as compared to 30 m products.
Accuracy – how far off is the mean? Bias. Precision – what is the standard deviation of the measurements? Averaging more ACFs or Spectra typically means better precision – but may not mean the results are accurate. Accuracy and Precision Low accuracy, high precision High accuracy, low precision
Typical processing 10 lag ACF 30 m range gate =10 averaged ACF/gate 1000 ACF/estimate Reprocessing 10 lag ACF 501 m range gate =167 averaged ACF/gate 16,667 ACF/estimate • 3 m sampling (10 ns) • 200 ns PW: 30 m • 100 pulse averaging • Scanning: 5 deg/sec System and processing parameters
PPI Scan at 45° Elevation: With Shear Mean of 30m data – 500m RG data
PPI Scan at 45° Elevation: With Shear Closest 30m data – 500m RG data
Instrument and atmospheric variance profiles Atmospheric vertical variance Instrument precision Wideband SNR
Average SNR usually about the same as 500 m range gates except in cases of strong turbulence and/or approaching “saturation.” Precision Improvements: 16.67 x more points (for a total of 16,667) should yield ~4X improvement in precision – for same SNR. We see ~2X improvement in precision. In other words, instrument “variance” drops by an average factor of ~4 instead of 16.67. Profile Wind speed “error”, Mean: -0.03 m/s, Std. Dev: 0.50 m/s. Profile Wind direction “error”, Mean: 0.34°, Std. Dev: 4.24°. Next for the 500 m. range gate study Closer look at differences in atmospheric variance estimates – are we underestimating instrument variance? This study assumed full azimuth scanning at 45° - what happens if we only have 2 stare angles? 500 m Range Gate Study: Preliminary Results
HRDL-TexAQS 2006: Relative 2µm Aerosol Backscatter Major Saharan dust events
True, HRDL was not calibrated for aerosol for TexAQS. HRDL avg. power constant throughout experiment (within 5% error on power-meter measurement). HRDL provided “relative” aerosol layer info during the experiment. In-situ measurements of particle size distribution, composition, absorption, extinction, etc. available Aerosol backscatter is affected by: Humidity Composition Distributions/ Concentration 2µm backscatter
A B C D E Integrated 2-10µm surface area HRDL SNR at 215 m altitude Correlation ~0.9 Surface area size distributions and HRDL SNR Image credit: D. Coffman, PMEL, NOAA
Particle size distributions: concentrations and backscatter Likely hard target returns
Backscatter dependence on RH and Particle Solubility Strong dependence on RH Some dependence on Solubility
2µm Backscatter: Caveats • CNR fit depends on: • Refractive turbulence • Transmission/extinction (estimated in Mie models) • Ship plume – strong refractive turbulence • Possible long-term system changes due to high vibration • Mie scattering models still “young” • Particle refractive index is highly composition dependent): Incorporate variable mass fractions of Ammonium Sulfate, Sea Salt, and Dust
Continuing work • Boundary Layer Heights – 600 m over Gulf • Streak Analysis and integration of HRDL data with models • Comparisons of HRDL with in-situ-based calculations of Backscatter, then… • Compare HSRL and CALIPSO and characterize the relationship between 1 and 2 micron backscatter in this area. • Extend the process to other areas.