Download
1 / 23
240 likes | 530 Views
Security Threats Severity Analysis. January 22, 2014. © Abdou Illia – Spring 2014. What is Severity Analysis?. Accessing security threats occurrence likelihood Accessing threats’ potential damage. Key Questions to be asked. What resources do I need to protect?

E N D
Security Threats Severity Analysis January 22, 2014 © Abdou Illia – Spring 2014
What is Severity Analysis? • Accessing security threats occurrence likelihood • Accessing threats’ potential damage
Key Questions to be asked • What resources do I need to protect? • What is the risk associated with potential threats? • How do I protect the valuable resources? • At what cost?
What resources do I need to protect? • Do an inventory • Do risk assessment • Quantitative risk assessment • NIST Guide: http://www.nist.gov/itl/csd/risk-092011.cfm • Assessment Template: http://www.eiu.edu/~a_illia/MIS4850/RiskAssmt_Template_07112007.doc • Qualitative risk assessment
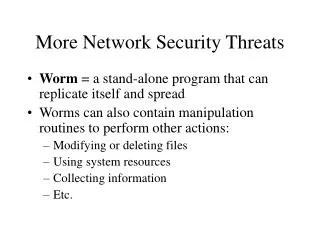
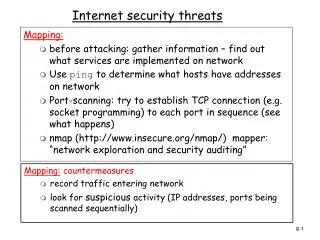
Accessing potential damage • Determining extent to which a threat could • Modify critical corporate data • Delete critical corporate data • Allow unauthorized access to confidential info. • Allow misdirection of confidential info. • Allow message alteration • Slow down network services • Jeopardize network service availability • Lead to loss of customers’ faith and trust • Lead to loss of employees or customers’ privacy
How do I protect the valuable resources? • Policies • Acceptable use policy • Firewall policies • Confidential info policy • Password policy • Remote Access policy • Security Awareness policy • … • Methods of protection • Antivirus • 128-key encryption • Two-factor authentication • …..
Step Threat A B C D 1 Cost if attack succeeds $500,000 $10,000 $100,000 $10,000 2 Probability of occurrence 80% 20% 5% 70% 3 Threat severity $400,000 $2,000 $5,000 $7,000 4 Countermeasure cost $100,000 $3,000 $2,000 $20,000 5 Value of protection $300,000 ($1,000) $3,000 ($13,000) 6 Apply countermeasure? Yes No Yes No 7 Priority 1 NA 2 NA Threat Severity Analysis
Exercise • Visit the www.sophos.com web site in order to gather information about a worm called W32/SillyFDC-FA and answer the following two questions. • Using bullets, list specific malicious actions that W32/SillyFDC-FA could take to potentially damage or disturb a computer system. • Use the questionnaire provided by the instructor to access the potential risk posed by W32/SillyFDC-FA. A complete In-class Exercise will be given in class with more details.
Realities • Can never eliminate risk • “Information assurance” is impossible • Risk Analysis • Goal is reasonable risk • Risk analysis weighs the probable cost of compromises against the costs of countermeasures • Also, security has negative side effects that must be weighed Copyright Pearson Prentice Hall 2013
Annualized Loss Expectancy (ALE) Single Loss Expectancy (SLE) Asset Value (AV) X Exposure Factor (EF) Percentage loss in asset value if a compromise occurs = Single Loss Expectancy (SLE) Expected loss in case of a compromise SLE X Annualized Rate of Occurrence (ARO) Annual probability of a compromise = Annualized Loss Expectancy (ALE) Expected loss per year from this type of compromise Copyright Pearson Prentice Hall 2013
Countermeasure A should reduce the exposure factor by 75% Copyright Pearson Prentice Hall 2013
2.4: Classic Risk Analysis Calculation (Figure 2-14) (continued) Countermeasure B should cut the frequency of compromises in half Copyright Pearson Prentice Hall 2013
2.4: Classic Risk Analysis Calculation (Figure 2-14) (continued) Although Countermeasure A reduces the ALE more, Countermeasure B is much less expensive. The annualized net countermeasure value for B is larger. The company should select countermeasure B. Copyright Pearson Prentice Hall 2013
2.4: Problems with Classic Risk Analysis Calculations • Uneven Multiyear Cash Flows • For both attack costs and defense costs • Must compute the return on investment (ROI) using discounted cash flows • Net present value (NPV) or internal rate of return (ROI) Copyright Pearson Prentice Hall 2013
Total Cost of Incident (TCI) • Exposure factor in classic risk analysis assumes that a percentage of the asset is lost • In most cases, damage does not come from asset loss • For instance, if personally identifiable information is stolen, the cost is enormous but the asset remains • Must compute the total cost of incident (TCI) • Include the cost of repairs, lawsuits, and many other factors Copyright Pearson Prentice Hall 2013
2.4: Problems with Classic Risk Analysis Calculations • Many-to-Many Relationships between Countermeasures and Resources • Classic risk analysis assumes that one countermeasure protects one resource • Single countermeasures, such as a firewall, often protect many resources • Single resources, such as data on a server, are often protected by multiple countermeasures • Extending classic risk analysis is difficult Copyright Pearson Prentice Hall 2013
2.4: Problems with Classic Risk Analysis Calculations • Impossibility of Knowing the Annualized Rate of Occurrence • There simply is no way to estimate this • This is the worst problem with classic risk analysis • As a consequence, firms often merely rate their resources by risk level Copyright Pearson Prentice Hall 2013
2.4: Problems with Classic Risk Analysis Calculations • Problems with “Hard-Headed Thinking” • Security benefits are difficult to quantify • If only support “hard numbers” may underinvest in security Copyright Pearson Prentice Hall 2013
2.4: Problems with Classic Risk Analysis Calculations • Perspective • Impossible to do perfectly • Must be done as well as possible • Identifies key considerations • Works if countermeasure value is very large or very negative • But never take classic risk analysis seriously Copyright Pearson Prentice Hall 2013
Risk Reduction • The approach most people consider • Install countermeasures to reduce harm • Makes sense only if risk analysis justifies the countermeasure • Risk Acceptance • If protecting against a loss would be too expensive, accept losses when they occur • Good for small, unlikely losses • Good for large but rare losses Copyright Pearson Prentice Hall 2013
2.4: Responding to Risk • Risk Transference • Buy insurance against security-related losses • Especially good for rare but extremely damaging attacks • Does not mean a company can avoid working on IT security • If bad security, will not be insurable • With better security, will pay lower premiums Copyright Pearson Prentice Hall 2013
2.4: Responding to Risk • Risk Avoidance • Not to take a risky action • Lose the benefits of the action • May cause anger against IT security • Recap: Four Choices when You Face Risk • Risk reduction • Risk acceptance • Risk transference • Risk avoidance Copyright Pearson Prentice Hall 2013