Download
1 / 39
390 likes | 542 Views
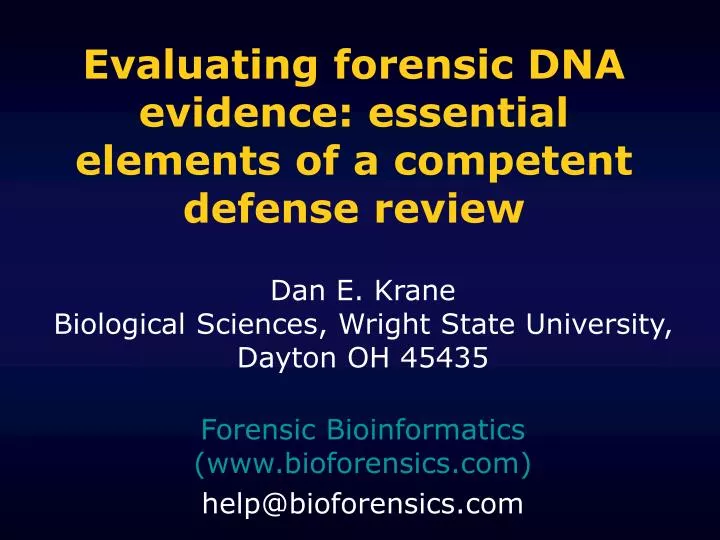
Evaluating forensic DNA evidence: essential elements of a competent defense review. Dan E. Krane Biological Sciences, Wright State University, Dayton OH 45435. Forensic Bioinformatics (www.bioforensics.com) help@bioforensics.com. Three generations of DNA testing. RFLP AUTORAD Allele = BAND.

E N D
Evaluating forensic DNA evidence: essential elements of a competent defense review Dan E. Krane Biological Sciences, Wright State University, Dayton OH 45435 Forensic Bioinformatics (www.bioforensics.com) help@bioforensics.com
Three generations of DNA testing RFLP AUTORAD Allele = BAND DQ-alpha TEST STRIP Allele = BLUE DOT Automated STR ELECTROPHEROGRAM Allele = PEAK
DNA content of biological samples: Type of sample Amount of DNA Blood 30,000 ng/mL 2 stain 1 cm in area 200 ng 2 stain 1 mm in area 2 ng Semen 250,000 ng/mL Postcoital vaginal swab 0 - 3,000 ng Hair plucked 1 - 750 ng/hair shed 1 - 12 ng/hair Saliva 5,000 ng/mL Urine 1 - 20 ng/mL
Basic terminology: Genetics • DNA Polymorphism (“many forms”) • Regions of DNA which differ from person to person • Locus (plural = loci) • Site or location on a chromosome • Allele • Different variants which can exist at a locus • DNA Profile • The combination of alleles for an individual
Basic terminology: Technology • Amplification or PCR (Polymerase Chain Reaction) • A technique for ‘replicating’ DNA in the laboratory (‘molecular Xeroxing’) • Region to be amplified defined by PRIMERS • Can be ‘color coded’ • Electrophoresis • A technique for separating molecules according to their size
STR • Short tandem repeat • Describes a type of DNA polymorphism in which: • a DNA sequence repeats • over and over again • and has a short (usually 4 base pair) repeat unit • A length polymorphism -- alleles differ in their length 3 repeats: AATG AATG AATG 4 repeats: AATG AATG AATG AATG 5 repeats: AATG AATG AATG AATG AATG 6 repeats: AATG AATG AATG AATG AATG AATG
BLUE D3 vWA FGA D8 GREEN D21 D18 Amelogenin D5 YELLOW D13 D7 Amelogenin XX = female XY = male 75 100 139 200 245 300 bps 150 RED Red = ROX size standard 160 Electropherogram Reading an electropherogramPeaks correspond to alleles
Crime Scene Samples & Reference Samples Differential extraction in sex assault cases separates out DNA from sperm cells • Extract and purify DNA
Extract and Purify DNA • Add primers and other reagents
PCR Amplification Groups of amplified STR products are labeled with different colored dyes (blue, green, yellow) • DNA regions flanked by primers are amplified
Detector Window ABI 310 Genetic Analyzer: Capillary Electrophoresis • Amplified STR DNA injected onto column • Electric current applied • DNA pulled towards the positive electrode • DNA separated out by size: • Large STRs travel slower • Small STRs travel faster • Color of STR detected and recorded as it passes the detector
x 0.222 x 2 Statistical estimates: the product rule 0.222 = 0.1
x x 1 in 111 1 in 20 1 in 22,200 x x 1 in 100 1 in 14 1 in 81 1 in 113,400 x x 1 in 116 1 in 17 1 in 16 1 in 31,552 Statistical estimates: the product rule 1 in 10 = 0.1 1 in 79,531,528,960,000,000 1 in 80 quadrillion
What more is there to say after you have said: “The chance of a coincidental match is one in 80 quadrillion?”
What more is there to say after you have said: “The chance of a coincidental match is one in 80 quadrillion?” • Two samples really do have the same source • Samples match coincidentally • An error has occurred
Sources of ambiguity in DNA testing results • Mixtures: deconvolution and relatives • Degradation, inhibition • Background noise • Stutter (n+4) • Pull-up • Spikes and blobs
Opportunities for subjective interpretation? D3: 12, 17 vWA: 15, 17 FGA: 22, 26
Sources of ambiguity in DNA testing results • Mixtures: deconvolution and relatives • Degradation, inhibition • Background noise • Stutter (n+4) • Pull-up • Spikes and blobs
0.02 8,151 25.53 11,526,219 71.07 32,078,976 3.38 1,526,550 How many contributors to a mixture if analysts can discard a locus? How many contributors to a mixture? There are 45,139,896 possible different 3-way mixtures of the 648 individuals in the MN BCI database.
Sources of ambiguity in DNA testing results • Mixtures: deconvolution and relatives • Degradation, inhibition • Background noise • Stutter (n+4) • Pull-up • Spikes and blobs
Sources of ambiguity in DNA testing results • Mixtures: deconvolution and relatives • Degradation, inhibition • Background noise • Stutter (n+4) • Pull-up • Spikes and blobs
Degradation SMALL LARGE • When biological samples are exposed to adverse environmental conditions, they can become degraded • Warm, moist, sunlight, time • Degradation breaks the DNA at random • Larger amplified regions are affected first • Classic ‘ski-slope’ electropherogram • Degradation is unusual.
Degradation The Leskie Inquest • Undegraded samples can have “ski-slopes” too. • How negative does a slope have to be to an indication of degradation? • Experience, training and expertise. • Positive controls should not be degraded.
Degradation The Leskie Inquest • DNA profiles in a rape and a murder investigation match. • Everyone agrees that the murder samples are degraded. • If the rape sample is degraded, it could have contaminated the murder samples. • Is the rape sample degraded?
Degradation The Leskie Inquest
Sources of ambiguity in DNA testing results • Mixtures: deconvolution and relatives • Degradation, inhibition • Background noise • Stutter (n+4) • Pull-up • Spikes and blobs
Pull-up (software differences) Classic Advanced
Spikes and blobs blob Peak Area Peak area spike Peak height Peak Height Blob: Peak Area / Peak Height > 10 + Spike: Peak Area / Peak Height < 4.5 -
Resources • Books • ‘Forensic DNA Typing’ by John M. Butler (Academic Press) • Internet • Applied Biosystems Website: http://www.appliedbiosystems.com/ (see human identity and forensics) • Forensic Bioinformatics Website: http://www.bioforensics.com/ • STR base: http://www.cstl.nist.gov/biotech/strbase/(very useful) • Scientists • Larry Mueller (UC Irvine) • Simon Ford (Lexigen, Inc. San Francisco, CA) • William C. Thompson (UC Irvine) • William Shields (SUNY, Syracuse, NY) • Marc Taylor (Technical Associates, Ventura, CA) • Keith Inman (Forensic Analytical, Haywood, CA) • Testing laboratories • Technical Associates (Ventura, CA) • Indiana State Police (Indianapolis, IN) • Other resources • Forensic Bioinformatics (Dayton, OH)