1 / 0

An Introduction to Big Data Ken Smith

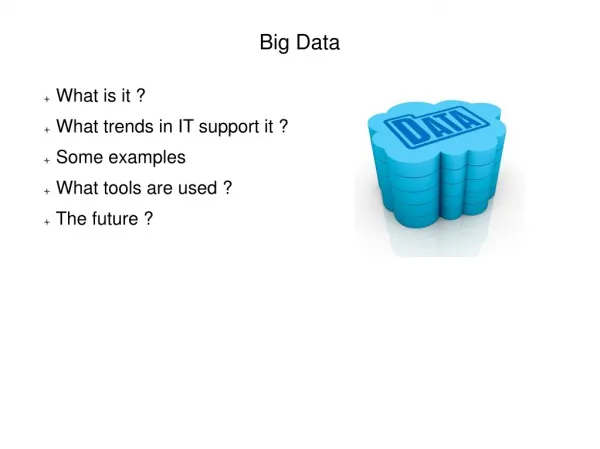
An Introduction to Big Data Ken Smith. April 10th , 2013. Big Data … Its Technologies & Analytic Ecosystem. Course Goal. Hype curve. ………….Tethered To Reality……. Outline. Background: What is “Big Data”? … Why is it big? Parallel Technologies for Big Data Problems Big Data Ecosystem

torn
Download Presentation

An Introduction to Big Data Ken Smith

An Image/Link below is provided (as is) to download presentation Download Policy: Content on the Website is provided to you AS IS for your information and personal use and may not be sold / licensed / shared on other websites without getting consent from its author. Content is provided to you AS IS for your information and personal use only. Download presentation by click this link. While downloading, if for some reason you are not able to download a presentation, the publisher may have deleted the file from their server. During download, if you can't get a presentation, the file might be deleted by the publisher.

E N D

Presentation Transcript


  1. An Introduction to Big DataKen Smith

    April 10th, 2013
  2. Big Data …Its Technologies & Analytic Ecosystem

  3. Course Goal Hype curve ………….Tethered To Reality…….......
  4. Outline Background: What is “Big Data”? … Why is it big? Parallel Technologies for Big Data Problems Big Data Ecosystem Ongoing Challenges
  5. What is “Big Data”? Credit: Big Data Now, Current Perspectives from O’Reilly Radar (O’Reilly definition); Extracting Value from Chaos, Gantz et al. (IDC definition); Understanding Big Data, Eaton et al. (IBM definition) O’Reilly: “Big data is when the size of the data itself becomes part of the problem” EMC/IDC: “Big data technologies describe a new generation of technologies and architectures, designed to economically extract value from very large volumes of a wide variety of data, by enabling high-velocity capture, discovery, and/or analysis.” IBM: (The famous 3-V’s definition) Volume (Gigabytes -> Exabytes) Velocity (Batch -> Streaming Data) Variety (Structured, Semi-structured, & Unstructured)
  6. Data Size Terminology
  7. A Simple Data Structure Taxonomy Structured data Data adheres to a strict template/schema spreadsheets, relational databases, sensor feeds, … Semi-structured data Data adheres to a flexible (grammar-based) format Optional fields, repeating fields Web pages / forms, documents, XML, JSON, … Unstructured data Data adheres to an unknown format No schema or grammar; you discover what each byte is and means by examining the data Unparsed text, raw disks, raw video & images, … “Variety”: constantly coping with structure variations; multiple types; changing types
  8. Why Are Volume & Velocity Increasing? 1) Internet-Scale Datasets Activity logfiles (e.g., clickstreams, network logs) Internet indices Relationship data / social networks Velocity note: Bin Laden’s death resulted in 5106 tweets/second
  9. Why Are Volume & Velocity Increasing? 2) Sensor Proliferation Weather satellites; flight recorders; GPS feeds; medical and scientific instruments; cameras Government agencies who want a sensor on every potentially mad cow, in every cave in Afghanistan, on every cargo container, etc. What if their wish is granted? Velocity notes: Large Hadron Collider generates 40T/sec High Def UAVs that collect 1.4P/mission Variety note: increasing # of sensor feeds  increasing variety
  10. Why Are Volume & Velocity Increasing? 3) Because, with modern cloud parallelism, you can ….  Problem: “Frequent close encounters” are suspicious Given: 73,241 ships reporting {id, lat, long} every 5 minutes for 2 weeks Resulting dataset = 15 GB (uncompressed and indexed) How do you detect all pairs of ships within X meters of each other? Many solutions generate intermediate “big data”
  11. What Good is Big Data? Some Examples! 1) As a basis for analysis As a human behavior sensor Supporting new approaches to science 2) To create a useful service
  12. Outline Background: What is “Big Data”? … Why is it big? Parallel Technologies for Big Data Problems Big Data Ecosystem Ongoing Challenges
  13. Traditional Scaling “Up”: Improve The Components of One System OS: multiple threads / VMs CPU: increase clock speed, bus speed, cache size RAM: increase capacity Disk: Increase capacity, decrease seek time, RAID
  14. Scaling “Out”: From Component Speedup to Aggregation Multicore cores on a chip (2, 4, 6, 8, ....)
  15. From Component Speedup to Aggregation Multiserver Racks (“Shared Nothing” – only interconnect)
  16. From Component Speedup to Aggregation Multi-Rack Data Centers
  17. From Component Speedup to Aggregation If you are Google or a few others: Multiple Data Centers
  18. The Resulting “Computer” & Its Applications OS CPU RAM Disk ...... This massively parallel architecture can be treated as a single computer Applications for this “computer”: Can exploit computational parallelism (near linear speedup) Can have a vastly larger effective address space Google and Facebook field applications whose user base is measured as a reasonable fraction of the human race
  19. The Power of Parallelism: Divide & Conquer “Work” Partition w1 w2 w3 “worker” “worker” “worker” r1 r2 r3 Combine “Result” Source: a slide by Jimmy Lin, cc-licensed
  20. Some Important Software Realities In a Massively Parallel Architecture Communication costs Fault-tolerance Programming abstractions
  21. “Numbers Everyone Should Know”From SoCC 2010 Keynote – Jeffrey Dean, Google L1 cache reference 0.5 ns Branch mispredict 5 ns L2 cache reference 7 ns Mutex lock/unlock 25 ns Main memory reference 100 ns Compress 1K w/cheap algorithm 3,000 ns Send 2K bytes over 1 Gbps network 20,000 ns Read 1 MB sequentially from memory 250,000 ns Round trip with same datacenter 500,000 ns Disk seek 10,000,000 ns Read 1 MB sequentially from disk 20,000,000 ns Send packet CA->Netherlands->CA 150,000,000 ns
  22. Some Important Software Realities In a Massively Parallel Architecture Communication costs Fault-tolerance Programming abstractions
  23. Fault Tolerance Frequency of faults in massively parallel architectures: Google reports an average of 1.2 failures per analysis job We assume our laptop will last through the week; but you lose this when you compute with 1000’s of commodity machines. What if the result waits because 499 / 500 worker tasks have completed but #500 never will finish: Strategy: Redundancy and checkpointing
  24. Some Important Software Realities In a Massively Parallel Architecture Communication costs Fault-tolerance Programming abstractions
  25. How Do You Program A Massively Parallel Computer? Parallel programming without help can be very painful! Parallelize: translate your application into a set of parallel tasks Task management: assigning tasks to processors, inter-task communication, task restart when they crash Task synchronization: avoiding extended waits and deadlocks Programmers need simplifying abstractions to be productive Pioneers Google & Facebook were forced to invent these Hadoop now provides a tremendous suite Analogy: RDBMSs provide the atomic transaction abstraction no programmer wants to worry about the details who is reading & writing data while they do! Just use “begin transaction” and “end transaction” to insulate your code from others using the system
  26. Apache Hadoop Open source framework for developing & running parallel applications on hardware clusters Cloudera & Hortonworks sell “premium” versions & support adapted from Google’s internal programming model available at: hadoop.apache.org Key components: HDFS (Hadoop Distributed File System) Map-Reduce (parallel programming pattern) Hive, Pig (higher-level languages which compile into Map-Reduce) HBase (key-value store) Mahout (data mining library) Some non-Hadoop parallel frameworks also exist: Asterdata & Greenplum sell {RDBMS + Map-Reduce + analytics}
  27. HDFS (Hadoop Distributed File System) Reduce Map HDFS files .. Underlying file system files .... HDFS: provides a single unified file system abstracting away the many underlying machines’ file systems load balances file fragments, maintains replication levels
  28. HDFS (Hadoop Distributed File System) HDFS components: NameNode manages overall file system metadata DataNodes (one per machine) manage actual data DataNodes are easy to add, expanding the file system Both DataNode and NameNodes include a webserver, so node status can be easily checked Example commands: “/bin/hdfsdfs –ls” lists files in an HDFS directory corresponds to linux “ls” “/bin/hdfsdfs -rm xx” removes HDFS file xx corresponds to linux “rm xx”
  29. HDFS Architecture Adapted from (Ghemawatet al., SOSP 2003)
  30. MapReduce Iterate over a large number of records Extract something of interest from each Shuffle and sort intermediate results Aggregate intermediate results Generate final output Map Build asequenceof MRsteps Reduce Key idea: provide a functional abstraction for these two operations
  31. Ideal MapReducable Problems Not all problems are “ideal”, but MR can still work: www.adjoint-functors.net/su/web/354/references/graph-processing-w-mapreduce.pdf 1) Input data can be naturally split into “chunks” and distributed 2) Large amounts of data If smaller than HDFS block size, don’t bother 3) Data independence Ideally, map operation does not depend on data at other nodes 4) Good redistribution key exists Output of map job is key-value pairs The key is used to shuffle/sort the output to the reducers Example: build a word-count index for a huge document corpus Map: emit {docid, word, 1} tuple for each occurence Reduce: sum similar tuples, like: {“War And Peace”, *, 1}
  32. MapReduce/HDFS Architecture From Wikipedia Commons: http://en.wikipedia.org/wiki/File:Hadoop_1.png
  33. Higher Level Languages: Hive *Hive optimizations at: citeseerx.ist.psu.edu/viewdoc/download?doi=10.1.1.151.2637 Hive is a system for managing and querying structured data Used extensively to provide SQL-like functionality: Compiles into map-reduce jobs Includes an optimizer* Developed by Facebook Almost 99.9% Hadoop jobs at Facebook are generated by a Hive front-end system.
  34. Apache Pig Open source scripting language Provides SQL-like primitives in a scripting language Developed by Yahoo! Almost 30% of their analytic jobs are written in “Pig Latin” Execution Model compiles into MapReduce (over HDFS files, HBase tables) Approximately 30% overhead Optimizes multi-query scripts, filter and limit optimizations that reduce the size of intermediate results Example commands FILTER: hour00 = FILTER hour_frequency2 BY hour eq '00'; ORDER: ordered_uniq_frequency = ORDER filtered_uniq_frequency BY (hour, score); GROUP: hour_frequency1 = GROUP ngramed2 BY (ngram, hour); COUNT: hour_frequency2 = FOREACH hour_frequency1 GENERATE flatten($0), COUNT($1) as count;
  35. The Human Approach Massively parallel human beings “crowdsourcing” A good list of projects: en.wikipedia.org/wiki/List_of_crowdsourcing_projects
  36. Outline Background: What is “Big Data”? … Why is it big? Parallel Technologies for Big Data Problems Big Data “Ecosystems” Ongoing Challenges in Big Data Ecosystems
  37. General “Funnel” Model of Big Data Analytic Workflows 3) Generate more structured datasets as needed: RDBMS tables, objects, triple stores 1) Ingest of diverse raw data sources: text, sensor feeds, semi-structured (e.g., web content, email) 4) Generate & explore user-facing analytic models (data cubes, graphs, clusters). Drill down to details. 2) Transform, clean, subset integrate, index, new datasets. Enrich: extract entities, compute features & metrics. Data science teams work across entire spectrum Some examples & technology stacks: Clickstream analysis; stock “tick” analysis; social network analysis Google’s Tenzing stack: SQL/OLAP over Hadoop Cloudera’s stack: Hive/Pig compiling into Hadoop Greenplum’s stack: SQL compiling directly onto servers, OR into MapReduce via “external tables”
  38. Ecosystem Overview A frequent workflow is emerging: 1) Ingest data from diverse sources 2) ETL / enrichment 3) Intermediate data management 4) Refined data management (graphs, parsed triples from text, OLAP/relational data) 5) Analytics & viz tools to build/test models, support decisions 6) Reachback into earlier steps by “data scientists” Common to diverse types of organizations: marketing, financial research, scientists, intelligence agencies, … (social media providers are a bit different: they host the big data) Many technologies working together Map reduce, semistructured (“NoSQL”) databases, graph databases, RDBMSs, machine learning/data mining algorithms, analytic tools, visualization techniques We will touch on some of these through the rest of today Many are new and evolving; this is a rapidly moving train!
  39. Emergence of the Data Scientist
  40. Spectrum of Big Data Ecosystem Classes Big Data Ecosystems differ along several key questions: 1) Is there a hypothesis being tested? Testing a hypothesis requires a more sophisticated analysis process 2) Is external data being gathered? Versus all internally generated data. External data requires more ETL effort 3) Does it make sense to evolve and expand this ecosystem? The greater the up-front investment, the more important it is to address serendipitous new hypotheses by reusing/augmenting existing data resources
  41. Spectrum of Big Data Ecosystem Classes 1) Non-experiment (no hypothesis exists, external data) No hypothesis or learning experiment Ecosystem reports aspects of external data, little analysis / new truth Example: CNN “trending now” alerts (Note: subject to being “gamed” by manipulation of external data!) 2) Evolving experimental ecosystem (hypotheses & external data) 3) Self contained experiment (hypothesis exists, no external data)
  42. The Non-Experiment(Example: “Trending Now”) 2)Basic processing applied to “add value” for consumers (but no rigorous model learning, or hypothesis testing) 1) External data ingested
  43. A Spectrum of Big Data Ecosystems 1) Non-experiment 2) Evolving experimental ecosystem (hypotheses, external data) 3) Self-contained experiment (a hypothesis exists, no external data) Pre-existent (scientific) hypothesis to test All necessary data generated to spec within the ecosystem Example: Argonne National Labs
  44. The Self-Contained Experiment(Example: Argonne National Labs) 1)A scientific hypothesis H exists, and a plan to test H by analyzing large datasets. Valid 4)Plan / model applied to data to validate/ invalidate H 2) Any data needed to test H is generated “internally” Notvalid 3)Data analysis. Perhaps requiring a predictive model to be learned & refined
  45. Spectrum of Big Data Ecosystem Classes 1) Non-experiment (no hypothesis exists, external data) 2) Evolving experimental ecosystem (potential hypotheses, external data) Massive external datasets suggest new insights / competitive advantage Hypothesis formed and external data gathered Experiment / ecosystem designed to test hypothesis, provide insight Once in place, ecosystem is reused & evolves: new data & hypotheses, cost amortized Sweet spot … (Consumer analysis, Intelligence analysis …) 3) Self-contained experiment
  46. Evolving Experiment Ecosystem: E3(Example: Google Adwords) 1)Massive external data suggests new insights / competitive advantages 1b)Incremental data suggests incremental insights … Valid Valid 4)Plan / model applied to data to validate/ invalidate H 2) Initial hypothesis H formed & data gathered to test it. Not valid Not valid 3)Data analysis. Perhaps requiring a predictive model to be learned & refined
  47. Questions?
  48. Outline Background: What is “Big Data”? … Why is it big? Parallel Technologies for Big Data Problems Big Data “Ecosystems” Ongoing Challenges in Big Data Ecosystems
  49. Some General & Ongoing Challenges Ecosystems are mature to the extent that they work now. But definitely not a fully “solved problem”!! Some outstanding issues to keep an eye on: Sampling What if two sources are sampled differently? Security Privacy Metadata E.g., How do we deal with evolution of processing? Moving/loading big data People finding, retaining, assigning to roles, training/growing, paying Outsourcing options disk growth beyond your budget, need for services you can’t provide
  50. Normal “Funnel” Model of Big Data Analytic Workflows - Assumption that all data “melts together” within the funnel
  51. Security-Partitioned “Funnel” Model of Big Data Analytic Workflows Assumption that certain data must not be mixed … How do you implement separation? Issues: What does this mean for the ability to aggregate, infer?
  52. Other Security Issues Parallel HW is often managed by 3rd parties for economics: Should I expose my sensitive data to DBAs who don’t work for me? What about other unknown/untrusted tenants of a rented HW infrastructure? Standard encryption only addresses data at rest When a query hits the DBMS it becomes plaintext in RAM. A rouge cloud DBA can see all my “encrypted” data. It’s hard to map high level policies onto detailed implementations, big data makes this worse E.g., Books about the stock market cannot be checked out to freshmen
  53. Accumulo Data Sensitivity Labels Label definition Labels (e.g., SECRET, NOFORN) are defined, applied on ingest Cryptographically bound to data Applied at the key-level (i.e., to every value individually) See: accumulo.apache.org/1.4/user_manual/Security.html Access: Database users obtain are assigned labels; these are used to gain access when a user authenticates as that user. Issues to consider: Admin overhead of defining and applying labels to every value Aligning heterogeneous label sets to realize possible sharing Label assurance
  54. Lack of Metadata As Harmful:
  55. Metadata Challenges in Sponsor Ecosystems Theme: Poorly understood datasets result in high overhead & degraded analytics 1) Exploiting myriads of datasets with agility What columns link voice recordings to radar? When do they simultaneously exist in this table? Where are temperature readings? 2) Dealing with “shape-changing” data sources When data format continually changes, how does my reader interpret serialized data instances without schema information? 3) Accurately matching analytics to datasets Analytic A requires column C1, derived by f8(). Does C1 exist for May? If C1 exists, but was derived from f7(), it would be bad if A “fails silently”! 4) Rapidly incorporating unknown data sources Can I reuse the ingest & transformation code from other data sources? 5) Reasoning about the data (data scientist needs) Where are value distributions & trends over time (e.g., to test a hypothesis, to infer semantics, for process optimization)…
  56. More Use Cases For Metadata Our Big Data sponsors are obligated to know: What data should be retained? Given the size of the data, all information can’t be retained forever. Decisions are currently made ‘off the cuff’ which data to retain, and which to let go. Can we characterize data’s use to support retention decisions? Where did this data come from? Analysts are writing reports and need to know the source of the data so they can determine trustworthiness, legality, dissemination restrictions, and potentially reference the original data object Where a class of data resides? This is largely a compliance and auditing function. A redacted use case would be: “Which of my systems currently house PII data? Do any systems house this data that aren’t approved for it? Are my security controls working?” With an increasing reliance on both public and private clouds, this is growing increasingly challenging. Where a specific data item resides? If the lawyers call and say I need to get rid of a certain piece of intelligence, can I locate all copies of it? Who else did I sent it to? If there is a breach at a cloud provider or partner, do I know what data items landed within their perimeter? This would enable more granular breach notifications.
  57. What is Provenance? “Family Tree” of relationships Ovals = data, rectangles = processes Show how data is used and reused Basic metadata Timestamp Owner Name/Descr Can also include annotations E.g. quality info Is not the actual data object
  58. How is it Done Today? The general approach is: “The developers just kinda know.” This does not scale! (with variety … the under-served “V”) Some large companies are now developing point solutions, as vast #’s of different data formats accumulate: Protobuf schema repository from Google Avro schema repository from LinkedIn Hive metacatalog (basis of hCatalog) But these are not general & powerful “first principles” solutions Format-specific data model (e.g., hCatalog favors Hive) Typically focus only on the “SeDe” issue “poor man’s metadata repository” https://issues.apache.org/jira/si/jira.issueviews:issue-html/AVRO-1124/AVRO-1124.html
  59. Questions?
  60. Next Topic in the Outline Intro to Big Data and Scalable Databases Part 1: Big Data…Its Technologies & Analytic Ecosystem Part 2: An Introduction To Parallel Databases Part 3: Technological Innovations and MPP RDBMS
  61. An Introduction To Parallel Databases

    Parallel Databases Parallel Databases Parallel Databases
  62. Purpose of This Talk Let’s say you have a problem involving: and Lots of data can apply multiple processors What can a database do for me? What databases are available? How do I pick?
  63. Outline Taxonomy Software realities for parallel databases Systems engineering strategies
  64. A Simple Taxonomy of Parallel Databases A Lot! BigTable / Hbase / Accumulo MongoDB FlockDB Non-relational (aka NoSQL) 1000 Max Number of Processors 100 Parallel Relational Traditional RDBMS Aster Data 10 Market Trends Consolidation Hybrids To “upper left” Greenplum 1 Structured Relational Triples, Key-value Semi-structured (e.g., “Document-oriented) “Clouds” are increasingly attractive computational platforms Traditional solutions don’t automatically scale well to clouds, innovation is occuring rapidly ... Data Model Structure
  65. A More Complex Taxonomy (451 group) Oh My!
  66. Taxonomy Used In This Talk Key-value stores Semi-structured databases Parallel relational Graph databases & Triplestores
  67. A Short History of Key Value Stores 2004: Google invented BigTable Now being replaced by Spanner (distributed transactions, SQL) 2007: Hbase (open source BigTable): hbase.apache.org Large & growing user community; HDFS file system 2008: Facebook invents Cassandra HBase data model, but P2P file system; released open source 2010: Facebook enhances & adopts HBase internally 2011: NSA releases Accumulo open source: accumulo.apache.org Similar to Hbase; includes data sensitivity labels 2012: Basho releases Riak: wiki.basho.com Web friendly; based on Amazon’s dynamo paper
  68. Key-Value Store Data Model Datasets typically modeled as one very large table Key: <row id, column id, version> Row id (canonical Google row id: reversed URL) Column id static number of carefully designed column “families” each family can have an unbounded number of columns Version-timestamp Database keeps record of all previous values (update = append) Query examples: given a full key, return the value given a column ID and a value, return all matching rows
  69. Other Characteristics of Key Value Stores Performance: designed for scale out 1 index on the key (faster than HDFS scan), no optimizer Cost: Typically open source; need Hadoop / programming skills Cloudera support is ~$4K/node Roles: Great fit: for data you don’t understand well yet (e.g., ETL) Massive, rapidly arriving, highly non-homogenous datasets Need for query by key; enriching by adding aribtrary columns Poor fit: if you know exactly what your data looks like (lose schema)
  70. HBase Table Creation Example Create a table named test with a single column family named cf. Verify its creation by listing all tables and then insert some values. hbase(main):003:0> create 'test', 'cf' 0 row(s) in 1.2200 seconds hbase(main):003:0> list 'test' .. 1 row(s) in 0.0550 seconds hbase(main):004:0> put 'test', 'row1', 'cf:a', 'value1' 0 row(s) in 0.0560 seconds hbase(main):005:0> put 'test', 'row2', 'cf:b', 'value2' 0 row(s) in 0.0370 seconds hbase(main):006:0> put 'test', 'row3', 'cf:c', 'value3' 0 row(s) in 0.0450 seconds
  71. HBase Example Verify the data insert by running a scan of the table: hbase(main):007:0> scan 'test' ROW COLUMN+CELL row1 column=cf:a, timestamp=1288380727188, value=value1 row2 column=cf:b, timestamp=1288380738440, value=value2 row3 column=cf:c, timestamp=1288380747365, value=value3 3 row(s) in 0.0590 seconds Get a single row: hbase(main):008:0> get 'test', 'row1' COLUMN CELL cf:a timestamp=1288380727188, value=value1 1 row(s) in 0.0400 seconds
  72. Taxonomy Used In This Talk Key-value stores Semi-structured databases Parallel relational Graph databases & Triplestores
  73. A Short History of Semi-structured Databases 1980’s: “Object-oriented” DBs invented; didn’t take off Addressed gap between relations & prog. Languages Good for data hard for RDBMS’s: aircraft & chip designs 1995: Stanford LORE project induces XML schema from data Coined term “semi-structured” due to flexible schema 2000’s: “Sharding” gave semi-structured databases new life Now often called “document oriented” (but not “Documentum”) Great list at en.wikipedia.org/wiki/Document-oriented_database 2009: open source MongoDB; 10gen support; JSON data model 2012: UCI Asterix project www.cs.ucsb.edu/common/wordpress/?p=1533 Goal: Open source “Postgres-quality” flexible schema DBMS
  74. Semi-structured Database Data Model Objects defined by grammar (XML, JSON) One table per object type; optional attributes Tight programming language interface Good compromise between Key-Value and RDBMS JSON Example: (JavaScript Object Notation) JSON provides syntax for storing and exchanging text information; JSON is smaller than XML and easier to parse. Looks much like C, Java, etc. data structures { "employees": [ { "firstName":"John" , "lastName":"Doe" }, { "firstName":"Anna" , "lastName":"Smith" }, { "firstName":"Peter" , "lastName":"Jones" } ] } The employees object is an array of 3 employee records (objects).
  75. Other Features of Semi-structured Databases Speed: shards for scale out; often a limited optimizer Cost: Some free, few features; some $500K, many features Killer app(s): Good fit for “like-but-varying” objects, accessed similarly would have used a relational database, but objects aren’t regular Rapid prototyping in scientific lab “Cloud server” – serving objects used as web content
  76. MongoDB Table Creation Example Create a collection named library with a maximum of 50,000 entries. > db.createCollection(”library", { capped : true, size : 536870912, max : 50000 } ) Insert a book (a JSON object): > p = { author: “F. Scott Fitzgerald”, acquisitiondate: new Date(), title: “The Great Gatsby”, tags: [“Crash”, “Reckless” “1920s”]} > db.library.save(p) Retrieve the book: > db.library.find( { title: “The Great Gatsby”} ) > { "_id" : ObjectId("50634d86be4617f17bb159cd"), “author” : “F. Scott Fitzgerald”, “acquisitiondate” : “10/28/2012", “title”: “The Great Gatsby”, “tags" : [“Crash”, “Reckless” “1920s”] }
  77. Taxonomy Used In This Talk This is Irina’s talk Key-value stores Semi-structured databases Parallel relational Graph databases & Triplestores
  78. Example Systems Many are “noSQL” systems Commercially available Proprietary Open source or Research Legend Open source, commerical version / support Open source, GOTS Key-value stores BigTableHbaseAccumulo, Cassandra, Riak, … Semi-structured MongoDB, CouchDB (JSON-like); Gemfire (OQL); Marklogic (Xquery, SQL), Asterix, … Parallel relational Vertica, Greenplum, AsterData, Paraccel, Teradata, Netezza, … Graph databases & Triplestores FlockDB (simple), “Big Linked Data”, Titan (Gremlin/Tinkerpop), Neo4j (Gremlin/Tinkerpop, SPARQL) AllegroGraph (SPARQL)
  79. Outline Taxonomy Some important software realities for parallel databases Sharding Optimizers Data Consistency Systems engineering strategies
  80. A Simple Comparison of Properties The Asterix system being developed at UCI intends to have a high score on all 5 properties
  81. Sharding All parallel DBMSs shard data somehow “Sharding” maps one table into a set of distributed fragments Each fragment located at a single compute node Horizontal partitioning Shards typically defined by key range partition; but various hashing strategies possible Speeds up parallel operations (e.g., search, summation) Replication Multiple copies can be generated for each partition Speeds read access, improves availability Issue: how do you shard graph data?? Facebook does it randomly! (No good split)
  82. Sharding Illustration Key Range 0..30 Key Range 31..60 Key Range 61..90 Key Range 91.. 100 Primary Primary Primary Primary Multiple copies Secondary Secondary Secondary Secondary Secondary Secondary Secondary Secondary Horizontal Partitions
  83. Software Realities for Parallel Databases Realities: Sharding Optimizers Transactions & Data Consistency
  84. Optimizers & Efficient Queries Scale out and/or optimizers? It depends!! Optimizers automatically rewrite user queries into an equivalent and more efficiently executable form Invented in the 70’s to make SQL possible The crown jewels of commercial (one node) RDBMSs! Parallel databases can “scale out” to improve performance Want an order of magnitude speedup? 100 1000 nodes! Many use a far simpler query language, if one at all (e.g., search by key) Less need/benefit for an optimizer Example: Hbase provides 1 index, bloom filters, caching, no optimizer Parallel relational databases Can scale out, and also provide optimizers to get more done with fewer nodes Very sophisticated data migration primitives (moving shards to the computation, if cheaper, managing solid state & disk, …)
  85. Flights.aircraft_id = Aircraft.id Pilot.name = Flights.pilot_name Optimizing a Single Node RDBMS Pilots Flights Aircraft Given 3 relations (tables) of data: Which pilots have flown prop-jets? (In SQL) SELECT DISTINCT Pilots.name FROM Pilots, Flights, Aircraft WHERE Pilot.name = Flights.pilot_name AND Flights.aircraft_id = Aircraft.id AND Aircraft.type = “prop-jets”
  86. Initial Query Execution Plan answer (the distinct pilot names) (10) project (only prop-jets - 0.1%) Total tuples processed: 30,012,060 (10,000) select (10,000,000) join (10,000,000) join scan (2000) (50) scan scan (10,000,000) Pilots Flights Aircraft Database : (50) (10,000,000) (2000)
  87. Query Optimization: Improved Plan answer (only distinct pilot’s names) (10) project Total tuples processed: 30,062 join (10,000) join (10,000) scan (50) (only prop-jets - 0.1%) indexed retrieval (10,000) select (2) Pilots Flights Aircraft Database : (50) (10,000,000) (2000)
  88. Parallel DBMS Optimizer Comparison Key value stores typically do not optimize queries; rely on scale out Semi-structured DBMS’s Typically a simple approach, also relying on scale-out MongoDB tries to determine best index when two are available Parallel RDBMSs Typically provide sophisticated optimizers Migration; reasoning about storage hierarchy Greenplum migration primitives www.greenplum.com/technology/optimizer: 1) Broadcast Motion (N:N) - Every segment sends target data to all others 2) Redistribute Motion (N:N) - Every segment rehashes the target data (by join column) and redistributes each row to the appropriate segment 3) Gather Motion (N:1) - Every segment sends the target data to a single node (usually the master)
  89. Software Realities for Parallel Databases Realities: Sharding Optimizers Transactions & Data Consistency
  90. +1 Global Data Consistency update +1 +1 Given updates to replicated data shards, how do you keep them all consistent? Classic DB theory solution: Two phase commit (2PC): all vote; if all say yes, then all commit Nice, but communication is costly in a global data center network! Thus, Amazon has been happy to sell a book it doesn’t have sometimes. Eventual consistency (a hallmark of early “NoSQL”) No guarantee of “snapshot isolation” Over time, replicas converge despite node failures & network partitions Many different flavors / implementations (e.g., HBase, Cassandra) See also: www.cs.kent.edu/~jin/Cloud12Spring/HbaseHivePig.pptx Google just invented “Spanner” (~2PC!) Global consistency via atomic clocks/GPS (not everyone has these ); reduces communications
  91. Outline Taxonomy Software realities for parallel databases Systems engineering strategies
  92. Systems Engineering Strategy You can often get by with just one parallel database a key value store for ETL, and some BI a parallel RDBMS for BI, and as a cloud server or no DBMS (e.g., just use HDFS) … But one size is NOT the best fit for all Sweet spots exist for each type This is different from relational era!
  93. Roles In The Funnel Workflow Model 3) Generate more structured datasets as needed: RDBMS tables, objects, triple stores 1) Ingest of diverse raw data sources: text, sensor feeds, semi-structured (e.g., web content, email) 4) Generate & explore user-facing analytic models (data cubes, graphs, clusters). Drill down to details. 2) Transform, clean, subset integrate, index, new datasets. Enrich: extract entities, compute features & metrics. 1) Key value stores: Manage & query ETL datasets, compute metrics 2) Semi-structured DBS: Persist / query generated objects 3) Parallel RDBMSs, Graph DBS: Support BI queries, graph exploration, …
  94. Some Systems Engineering Strategies 1) Tunnel vision: Use one type of DBMS & just live with its shortcomings if/when you encounter them 2) Optimal assignment: Pick the best one for each type of workload you will encounter It takes skill to know how to pick, mix, match up front! 3) Keep your eye on it: Look at user experiences (forums), best practices Pick initial system(s) that look right & be ready to learn as you go May migrate to a more “final” system over time Google, Facebook are doing this all the time! BigTable to Caffeine to Spanner; Cassandra to (customized) HBase
  95. Questions?
More Related