Download

1 / 19
190 likes | 293 Views
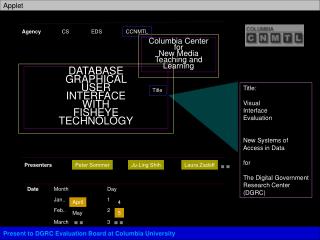
VISUAL INTERFACE DATABASE WITH FISHEYE TECHNOLOGY. Visual Interface Usability Evaluation For Energy Database Collection Project (EDC) of Digital Government Research Center (DGRC). Peter Sommer Ju-Ling Shih, Laura Zadoff. Columbia Center for New Media Teaching and Learning. About the Project.

E N D
VISUAL INTERFACE DATABASE WITH FISHEYE TECHNOLOGY Visual Interface Usability Evaluation For Energy Database Collection Project (EDC) ofDigital Government Research Center (DGRC) Peter Sommer Ju-Ling Shih, Laura Zadoff Columbia Center for New Media Teaching and Learning
About the Project • Project Description • Video Clip • Project Description (Judith Klavans) • Rationale for Evaluation (Judith Klavans) • Project Presentation • Video Clip • Project Presentation (Surabhan Temiyabutr) • Screen Shot • Old DGUI • New DGUI • Gummy Bear Show • Websites • DGUI • Old Gummy Bear Show • Colorful Gummy Bear Show
Goals of Evaluation • optimize the effectiveness of the interface, • identify usability problems, • provide feedbackon the overall functionality, • anticipate changes in user need that might drive future development, • validate the design, • indicate the extent to which the interface improves on previous interfaces.
Methods of Evaluation • Contrast Analysis • Heuristics • Task Analysis • Questionnaires
Contrast Analysis Menu System vs. Fisheye • Technological • Functionality • Query efficiency • Friendliness • User • Query styles • Strategies • Easiness • Heuristics: see comparison chart.
Comparison Example e.g. (3.D) Tracing ability. Documentation of search process and task steps to enable users to trace their footprints. • DataGate: DataGate allows you to save files or download datasets onto local drives so the users can continue unfinished work in other time. It allows users to download the queries and print out search results. • Others: Some databases allow users to go back to a previous stage in the query history. • Fisheye: Users can see the context and options on the screen, therefore can go for an alternative path for a query.
Analysis of Traditional Database • Query Log Analysis of EDS DataGate • Flexibility in Choosing Variables • Options to Sets of Variables • Options to Adjust Individual Variable • Keyword Search: Search Methods and Syntax • “All” vs. “Any” • “And” vs. “Or” • Modification of Queries • From General to Specific • From Specific to General
Interviews • Interdisciplinary Conversation • Interviewees: • EDS librarians • Jane Weintrop • Nicole Fox • Reference Desk librarians • Jerry Breeze • Alysse Jordan
Interview Findings User Type Identification User Goals Kinds of Questions Brief History of Search Types of Searches Related Terms for Searches Selecting the database Learning to use the Interface Student’s Searching Styles Searching Styles of Fisheye Design Flexibility to Searching Styles Helping the User Define the Search Standardize Problem Librarians’ Duty Suggestions for the Fisheye Design
Heuristics • Goal • Usability inspection method targeting on interface design by judging compliances to certain principles for successful design. • Evaluators • Library Staff • Design • Adapted from existing research • Modified for Energy Database • Heuristics • Five Categories • Appearance, Language, Functionality, Structure, Assistance
Task Analysis • Process • Task Scenarios • Interview • Observation • Goal • User Behaviors • User Intuitiveness for Different Groups of Users • Strengths and Weaknesses of the Design • Participants • Content Experts • Government Agency Workers • Faculty and Students
Questionnaire • Upon Completion of the Project • Target on Actual Users • Summative Evaluation • Preliminary Questionnaire • Timeline