Download
1 / 21
210 likes | 344 Views
Attributes of Well-Performing Water Utilities including two mapping tools for utility reforms. Capacity Building Module. Customer orientation. reporting & “listening” to clients. being answerable to another party for policy decisions, for the use of resources, and for performance.

E N D
Attributes of Well-Performing Water Utilitiesincluding two mapping tools for utility reforms Capacity Building Module
Customer orientation reporting & “listening” to clients being answerable to another party for policy decisions, for the use of resources, and for performance Accountability being independent to manage professionally without arbitrary interference by others Autonomy Critical dimensions of a well run (public or private) utility
What? Degree to which utilities report and “listen” to their customers, work to better meet their needs Customer orientation increases accountability of the service provider to its customers How? Actively survey customers to learn their views and preferences in order to make better decisions Use customer information to steer decision making Have developed billings and collection systems that best overcome specific constraints faced by various customer groups Inform customers about service changes and interruptions Have developed effective complaint resolution mechanisms Customer Orientation Customer orientation ‘pays’! (happy customers pay for services)
Invested in knowing what their customer wanted: Surveys about 200 customers per month on their level of satisfaction with provided services Uses customer information for management decisions: Surveys feed into the Balanced Scorecard which is used to support strategic decision-making ‘client perspective’ is the most important of a number of ‘perspectives’ by which performance is measured in the Balanced Scorecard Information is not yet methodologically used to define corporate strategies and priorities but scorecard focuses staff’s priorities thus increasing efficiency Invested in mechanisms to improve services: customer information through bill stuffers and the media expanded modes of billing and collection to minimize waiting times at utility office Established tracking system for complaints frequent customer management training for staff Example: SIMAPAG (Guanajuato, Mexico) Results • Between 1996 and 2001: SIMAPAG’s income from customers increased by 280% from approximately $141,000 to over $400,000. • Funds have been reinvested to improve water supply services and helped to expand sewerage services But…in 2003: the city council lowered monthly automatic tariff increase from 1.1% to 0.01% (< inflation)
Customer orientation reporting & “listening” to clients being answerable to another party for policy decisions, for the use of resources, and for performance Accountability being independent to manage professionally without arbitrary interference by others Autonomy Critical dimensions of a well run (public or private) utility
Hard measures Business plans Systematic reporting between various levels Incentives (rewards and penalties) to achieve well-defined performance targets Standard processes, streamlined procedures Cost accounting techniques that link resources to outputs Outsourcing, market testing Benchmarking Soft measures Training to improve staff skills Strong corporate culture Moral and behavior norms that inspire staff and management to excel Clear vision and mission statements Shaped by top management Utilities with Internal Accountability & Autonomy …have shifted from traditional hierarchical set up to flatter decision-making structures
Internal decentralization of responsibilities: Multilayered organization Departmental heads are accountable for results - expenditure approval ceilings for various management levels Outsources 25% of the operating budget Decentralization is supported by good info: Performance indicators reported bi-monthly to the Board and published annually Standard business processes and systems (ISO-9001) Well-defined communication channels, including scheduled regular meetings Corporate culture: Clear merit-based promotion policies Grooming of staff and rotation policies Extensive training of staff (1.8% of operational budget) Visible mission statement PUB performance (2002) Example: Public Utilities Board (Singapore)
Degree of independence from external interference in utility manager’s decision-making Extent to which external stakeholders (governments, financiers, customers) are able to sanction the utility for results and use of resources External Autonomy and Accountability Accountability Autonomy
financial financial political strategic political strategic Space to maneuver Space to maneuver technical technical External autonomy: creating room to deliver
External accountability A utility functions in a web of accountabilities to a variety of external actors with different functions Actors • Central governments • Local governments • Customers • Financing institutions • Regulators Functions • policy making • Ownership (utility and asset) • Regulation • Demand for services • Financing
Example: Johannesburg, South-Africa Several external actors fulfill different functions
Further information Available at: http://siteresources.worldbank.org/INTWSS/Resources/Workingnote9.pdf
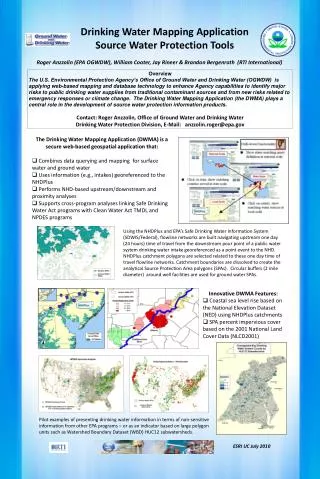
Tool 1 Mapping internal vs external reforms
Sustainable utility reform and reform of the environment have to go hand-in-hand Our goal good Typical reform path environment Possible combinations environment status/utility provider status poor utility poor good
03 staff performance contracts 02 automatic tariff indexation 00 ext & int performance contracts 98-00 service & revenue enhancement programs 98 new MD 97 new Board 97 corporate plan 95 new statute end 80s & 90s Major rehab mid 80s new government 70s political turmoil How Uganda combined reform measures for the NWSC utility and its environment Reform of the environment Utility reform
Tool 2 Mapping external accountabilities
Utility Customers National Government Local Government Mapping the map ofaccountabilities of a utility A traditional utility: accountability skewed towards local government
Utility Utility Utility Utility Customers • Raise tariffs • Raise tariffs • Raise tariffs Customers Customers Customers Local Government National Government • Source external funding • Source external funding Local Government National Government • Introduce regulator Independent regulator National Government National Government Local Government Local Government Bank Bank Balancing and diversifying accountabilities What could be done?
Introduction of group work • Groups of 5-10 people each. Each group appoints a chair and a rapporteur. • Each group gets assigned a case. • Groups get 30 minutes to discuss. • Each rapporteur has 5 minutes to report back to the whole class (with flipchart) Questions for each group Define the accountability framework of the utility? • To which actors is the utility accountable? • Which of the following functions exercises each of these actors: • What is the relative ‘strength’ of each actor to hold the utility accountable on a scale of 0-3? • Based on (a), (b) and (c), draw the accountability map of the utility. If you have time left: • how could one better balance the utility’s accountabilities and create more autonomy for the utility?