Download
1 / 16
160 likes | 267 Views
Comparison of Phenylalanine v. Tyrosine rotamers using 3D modeling software. Sam Portillo BNFO 300. PDB Statistics 1. Table 1 1. PDB Statistics 1. Ahmed et al (2015) uses “hint!” ( h ydropathic int actions ). Fig. 1 4,5. Ahmed et al (2015) used hint! to analyze 30,000 tyrosines.

E N D
Comparison of Phenylalanine v. Tyrosine rotamers using 3D modeling software Sam Portillo BNFO 300
PDB Statistics1 Table 11
Ahmed et al (2015) uses “hint!” (hydropathic intactions) Fig. 14,5
Ahmed et al (2015) used hint! to analyze 30,000 tyrosines Fig. 21,4
Clusters found in square a11 Fig. 34
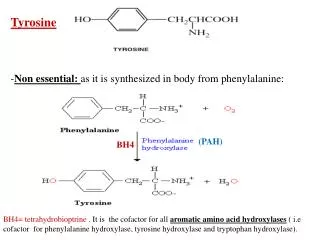
Tyrosine Phenylalanine The Experiment Fig. 47
Tables 2,34 Residue phi psi a b c d e f g h N-term Tyr 1 631 2240 713 46 0 3 5 0 0 2 2 22 13 1 0 13 0 0 1 3 1 24 36 31 2 7 6 0 1 4 6 228 2888 5376 3 21 7 1 6 5 5 700 2449 250 2 85 157 1 2 6 13 345 232 0 1 414 26 0 0 7 20 710 585 21 2 36 8 0 6 8 332 5301 4005 854 1 4 4 0 17 C-term 12 95 55 0 0 3 0 1 Residue phi psi a b c d e f g h N-term Phe 1 735 2150 724 44 0 1 0 1 4 2 3 16 19 1 0 8 2 0 1 3 4 42 33 27 11 4 0 1 7 4 6 190 3438 6364 4 5 14 0 16 5 4 679 2410 276 0 81 64 0 9 6 8 375 362 2 0 349 19 0 14 7 31 745 777 18 0 12 1 1 26 8 385 5118 4603 787 1 2 9 2 27 C-term 23 98 76 2 1 6 0 0
Ulmschneider Study Fig. 58
References • Berman, H. M., Westbrook, J., Feng, Z., Gilliland, G., Bhat, T. N., Weissig, H., … Bourne, P. E. (2000). The Protein Data Bank. Nucleic Acids Research, 28, 235–242. Retrieved from https://www.rcsb.org/pdb/statistics/holdings.do • Salzberg, S. L., Searls, D. B., & Kasif, S. (1998). Grand Challenges in Computational Biology. In Computational Methods in Molecular Biology (pp. 3–10). Elsevier Science B.V. Retrieved from https://app.knovel.com/web/view/khtml/show.v/rcid:kpCMMB0001/cid:kt00BYFA5K/viewerType:khtml/root_slug:1-grand-challenges-in-computational-biology/url_slug:grand-challenges-in-computational?b-toc-cid=kpCMMB0001&b-toc-root-slug=&b-toc-url-slug=grand-challe • Huang P-S, Boyken SE, Baker D. The coming of age of de novo protein design. Nature. 2016;537(7620):320-327. doi:10.1038/nature19946. • Ahmed, M. H., Koparde, V. N., Safo, M. K., Neel Scarsdale, J., & Kellogg, G. E. (2015). 3D interaction homology: The structurally known rotamers of tyrosine derive from a surprisingly limited set of information-rich hydropathic interaction environments described by maps. Proteins: Structure, Function and Bioinformatics, 83(6), 1118–1136. https://doi.org/10.1002/prot.24813 • Ramachandran GN, Ramakrishnan C, Sasisekharan V. Stereochemistry of polypeptide chain configurations. J Mol Biol. 1963;7(1):95-99. doi:10.1016/S0022-2836(63)80023-6. • Peptide Bonds and Protein Backbones. • Helmenstine, A. M. (2017). Amino Acid Structures. Retrieved from https://www.thoughtco.com/amino-acid-structures-4054180 • Ulmschneider, M. B., & Sansom, M. S. P. (2001). Amino acid distributions in integral membrane protein structures. BiochimBiophys Acta, 1512(1), 1–14. https://doi.org/10.1016/S0005-2736(01)00299-1

![Data Modeling [Comparison of data modeling techniques ]](https://cdn0.slideserve.com/205866/data-modeling-comparison-of-data-modeling-techniques-dt.jpg)

![Data Modeling [Comparison of data modeling techniques ]](https://cdn3.slideserve.com/6795343/data-modeling-comparison-of-data-modeling-techniques-dt.jpg)