Download
1 / 5
50 likes | 203 Views
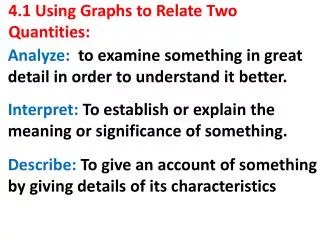
4.1 Using Graphs to Relate Two Quantities. Objective: To represent mathematical relationships using graphs. 4.1 Using Graphs to Relate Two Quantities. Example 1: The graph show the volume of air in a balloon as you blow it up until it pops. Vol What are variables?

E N D
4.1 Using Graphs to Relate Two Quantities Objective: To represent mathematical relationships using graphs
4.1 Using Graphs to Relate Two Quantities • Example 1: The graph show the volume of air in a balloon as you blow it up until it pops. • VolWhat are variables? Describe how they are related to each other? time
4.1 Using Graphs to Relate Two Quantities • P. 235 Example 2
4.1 Using Graphs to Relate Two Quantities • Example 3: A model rocket rises quickly and then slows to a stop as its fuel burns out. It begins to fall quickly until the parachute opens, after which it falls slowly. Graph the height vs time.
4.1 Using Graphs to Relate Two Quantities • HW p. 237 5 – 13 all