Download
1 / 12
120 likes | 125 Views
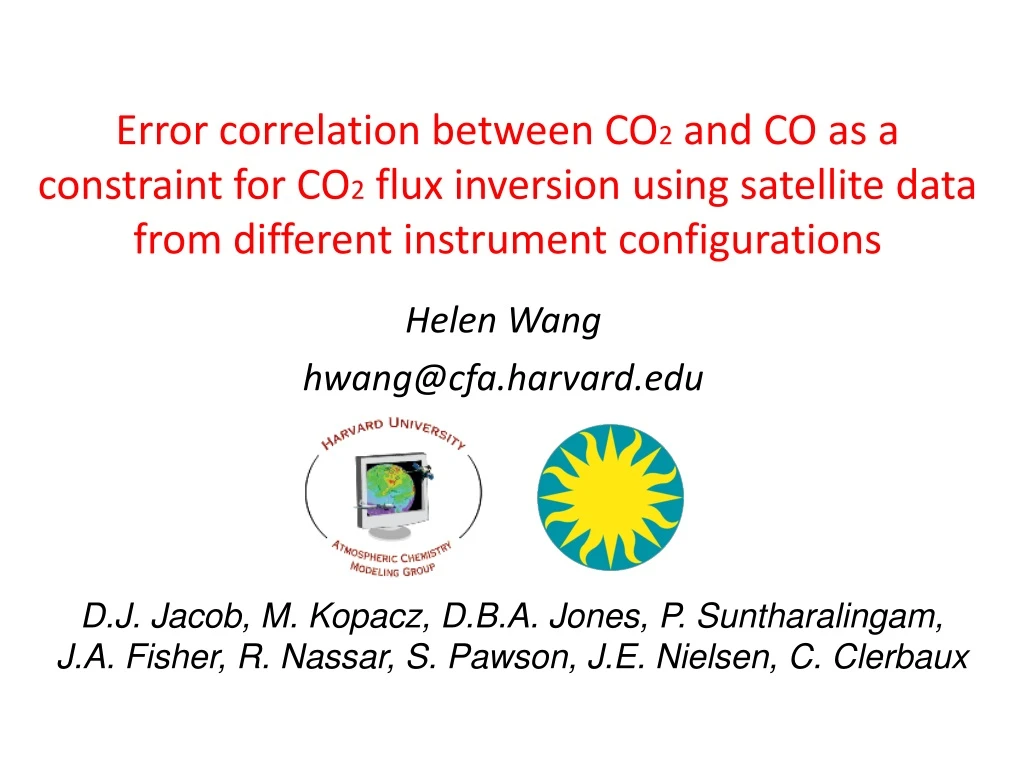
This study investigates the correlation between CO2 and CO in order to improve CO2 flux inversion using satellite data with different instrument configurations.

E N D
Error correlation between CO2 and CO as a constraint for CO2 flux inversion using satellite data from different instrument configurations Helen Wang hwang@cfa.harvard.edu D.J. Jacob, M. Kopacz, D.B.A. Jones, P. Suntharalingam, J.A. Fisher, R. Nassar, S. Pawson, J.E. Nielsen, C. Clerbaux
CO2 CO 50 ppb 150 380 PPM 388 MOPITT AIRS TES IASI SCIA GOSAT OCO? ASCENDS Pm CO CO,CO2 CO,CO2 CO2 CO2 CO2, CO? am CO,CO2 CO,CO2 Similarities between CO2 and CO GEOS-Chem simulated column for January 2006 • Both share common combustion sources & transport : Correlation • CO has stronger CO gradient : more sensitive to transport error • CO is relatively easier to observe from space: additional useful information TIR (mid/upper toposphere) NIR (down to PBL) Active
CO2 – CO joint inversion Forward model: Jacobian Observation vector CO2 and CO concentration State vector CO2 and CO surface flux Inverse model minimizes cost function: Observation error covariance a priori error covariance
r : error correlation coefficient Coupling between CO2 and CO occurs through off-diagonal elements in error covariance matrices S CO2:CO a priori error correlation is weak due to large uncertainties in CO emission factor. CO2:CO observational error correlation is potentially useful in joint inversion.
Observational error Instrument error Representation error Model error resolution &timing mismatch among retrieval, forward & inverse model instrument noise retrieval error transport & chemistry smoothing error Covariance between CO2 and CO occurs through model error : observational error in inverse flux modeling Model error is dominant for satellite CO [Heald et al., 2004] important for satellite CO2 [Baker et al., 2008]
Jan 2006 (65W, 54N) ΔCO (kg/m2) ΔCO2 (kg/m2) CO2 – CO model error correlation calculation: paired-model and paired forecast method rM=0.96 • For each grid box and each month: Correlate time series of differences between CO and CO2 runs 1. Paired model: Perform runs with the same surface fluxes driven by different meteorology for CO2 and CO 2. Paired forecast: 48-hour – 24-hour chemical forecast that are valid at the same time
Jan 2006 July 2006 Model error correlation coefficients from paired model method 1PM CO : 1PM CO2 without averaging kernels Positive correlation in winter due to common combustion and combustion & respiration region overlap Negative correlation in summer due to CO2 uptake by biosphere Correlation pattern is robust w.r.t. methods, meteorology & CO2 flux changes of NTE magnitudes
CO combustion 50% CO2 combustion 30% CO2 biosphere 80% CO chemistry 30% Rest of the World 30% 14-region analytical inversion using pseudo data with & without CO2 – CO model error correlation Sate vector X a priori uncertainty Assume 90% of observational error is due to model error
Jan 2006 biosphere CO combustion 50% CO2 combustion 30% CO2 biosphere 80% CO chemistry 25% Rest of the World 30% 0.5 0.75 1.0 a posteriori error covariance matrix Smaller α implies greater improvement 14-region analytical inversion using pseudo data with & without CO2 – CO model error correlation Sate vector X a priori uncertainty Assume 90% of observational error is due to model error
CO combustion CO2 combustion α CO2 biosphere α Joint inversion show substantial improvement during Dec – Apr for mid – high latitudes Short bar implies big improvement relative to single species inversion The Tropics show <20% improvements year round
NIR CO PM – NIR CO2 PM NIR CO AM – NIR CO2 PM TIR CO PM – TIR CO2 PM TIR CO PM – NIR CO2 PM Model error correlation for Jan 2006 with kernels Matching local time NIR CO and CO2 have the best model error correlation
Jan 2006 results with pseudo data for various instruments CO : CO2 NIR_PM : NIR_PM TIR_PM : NIR_PM NIR_AM : NIR_PM TIR_AM : NIR_PM TIR_PM : TIR_PM Assume model error accounts for 90% of observational error for CO and CO2 Best result is expected for matching sample time and flat averaging kernel Results are better when model error accounts for a larger fraction Improvement is still significant with relaxed requirements (75% CO, 62.5%CO2)