Download
1 / 38
380 likes | 619 Views
Ultrafine Particles and Freeways. Yifang Zhu , Ph.D. Assistant Professor Department of Environmental Engineering Texas A&M University –Kingsville Email: yzhu@even.tamuk.edu yifang.zhu@tamuk.edu. Comparison of PM10, PM2.5, and Ultrafine PM. Ultrafine PM (0.1 m m). PM2.5 (2.5 m m).

E N D
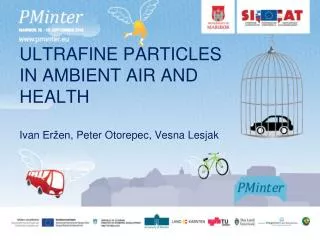
Ultrafine Particles and Freeways Yifang Zhu , Ph.D. Assistant Professor Department of Environmental Engineering Texas A&M University –Kingsville Email: yzhu@even.tamuk.edu yifang.zhu@tamuk.edu
Comparison of PM10, PM2.5, and Ultrafine PM Ultrafine PM (0.1 mm) PM2.5 (2.5 mm) PM10 (10 mm) PM2.5 (2.5 mm) PM10 (10 mm) Relative size of particles Human Hair (60 mm diameter)
Number Distribution UltrafineParticles Mass Distribution PM2.5 PM10 Atmospheric Aerosols: Particulate Matter (PM) Size Distribution Source: Hinds 1999
Particle Regional Deposition for Light Exercise Number Weighted Head Airways Alveolar Mass Weighted Tracheobronchial 1 10 100 1000 10000 Particle Diameter (nm)
Translocation of UFP from NP and TB region along sensory neurons to CNS (neurodegeneration) • Translocation of UFP to • interstitium, capillaries, heart • Uptake by endothelium; platelets • Activation/interaction of endothelial • cells, platelets and leukocytes Alveolar inflammation Pathways of Particle Translocation Within and Outside Respiratory Tract
Night Day Sampling Site
Scanning Mobility Particle Sizer (SMPS): Particle Size Distribution (6-300 nm) Condensation Particle Counter (CPC): Total Particle Number Concentration Dust Trak: Real time PM10, PM2.5 Q-Trak: CO, CO2, Temp, Rh Portable Aethelometer: EC Weather Wizard III: Wind speed and direction INSTRUMENTS
Traffic Effect: Total Particle Number Concentration & Traffic Density Zhu et al., 2002a
Normal Traffic Traffic Slowdown Zhu et al., 2002a
RESULTS:Change in Ultrafine Particle Size Distribution with Increasing Distance Day Zhu et al., 2002a
RESULTS: Number Concentration for Different Size Ranges Vs. Increasing Distance from Freeway 405. Zhu et al., 2002a
RESULTS: Relative Particle Number, Mass, Black Carbon, CO Concentration, Vs. Downwind Distance from Freeway 405. Zhu et al., 2002a
Nighttime Dominant Wind Nighttime Dominant Wind RESULTS:Decay of Total Particle Number Concentration Daily exposure to Ultrafine Particles: 3 folds of difference between the two cases
Nighttime Dominant Wind Nighttime Dominant Wind RESULTS:Decay of Total Particle Number Concentration
Y=5.17e3+1.17e5exp(-0.071X) R2=0.99 Y=7.35e4-1.74e3X R2=0.98 RESULTS:Temperature Effect Zhu et al, 2006
Indoor Study Sampling Site and Dominant Wind Zhu et al., 2005
RESULTS: Effect of distance from freeways Apartment 1 Apartment 2 Zhu et al., 2005
RESULTS: Effect of Ventilation Conditions on Size Segregated I/O Ratios Zhu et al., 2005
RESULTS: Effect of Ventilation Conditions on Size Segregated I/O Ratios Zhu et al., 2005
RESULTS: Effect of Ventilation Conditions on Size Segregated I/O Ratios Zhu et al., 2005
Outdoor and In-Cabin Size Distribution Time Series Zhu et al., 2007
Average Outdoor UFP Distribution on Different Freeways Zhu et al., 2007
Average In-Cabin UFP Distribution on Different Freeways Zhu et al., 2007
Similar I/O Ratio Profiles on Different Freeways Zhu et al., 2007
Effect of Ventilation Conditions on I/O Profiles Zhu et al., 2007
TAKE HOME MESSAGES • Because of dilution (and coagulation/condensation) ultrafine particles behave like a local source. • Central station monitoring not useful for estimating dose • 1 hr on freeway exceeds 23 hrs away from freeway. • Newer vehicles with recirculation on helps to reduce in-cabin ultrafine particle exposure.
TAKE HOME MESSAGES • Most ultrafine particles formed after exhaust leaves the tailpipe • Cooling and dilution both occurring • Cooling increases nucleation • Dilution decreases nucleation • Complex physical process • Sensitive to environmental conditions
FUTURE WORD • Assessing Children’s Exposure to Ultrafine Particles from Vehicular Emissions • Objective: To identify hot spots in South Texas where school children are likely to be exposed to high levels of UFPs and develop simple models to estimate children’s exposure to UFPs from vehicular emissions. • Using In-Situ Observations to Quantify Emissions from Prescribed Fires in two Grassland-Pine Ecosystems • Objective: To directly quantify UFP emissions from prescribed fires on DoD managed grassland and grass-shrub type ecosystems with different fuel types and fuel loadings.
FUTURE WORD Master and Ph.D. Students will be Financially Supported in Part by National Science Foundation (NSF) sponsored Center for Research Excellence in Science and Technology (CREST)- Research in Environmental Sustainability for Semiarid Coastal Areas (RESSACA) at Environmental Engineering Department at Texas A&M University-Kingsville.