Download
1 / 43
1.55k likes | 3.35k Views
Basic Knowledge of Transportation Planning (1) Lectures 16 Trip Generation & Trip Distribution (Chapter 8, Textbook). Transportation Planning and Travel Demand Forecasting. Transportation Planning. Definition from Papacostas and Prevedouros:

E N D
Basic Knowledge of Transportation Planning (1) Lectures 16Trip Generation & Trip Distribution(Chapter 8, Textbook)
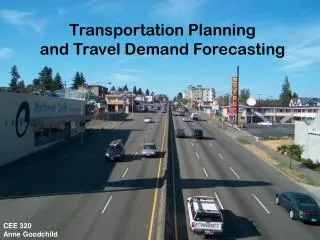
Transportation Planning • Definition from Papacostas and Prevedouros: • The activity or process that examines the potential of future actions to guide a situation or a system toward a desired direction, for example, toward the attainment of positive goals, the avoidance of problems, or both.
Most Important Aspect of Transportation Planning • Oriented toward the future: • A planning activity occurs during one time period but is concerned with actions to be taken at various times in the future.
Transportation Planning and Transportation Forecasting The number of vehicles on a planned freeway or bridge The ridership on a railway line The ridership on transit bus route The number of passengers patronizing an airport The number of ships calling on a seaport
Traditional Four-steps Transportation Forecasting Model Trip Generation Trip Distribution Mode Choice Trip Assignment
Traffic Analysis Zone • TAZ • Geographic Unit • Similar Land Use • TAZ boundaries are major roadways or physical barriers such as railroads, rivers, etc.
Trip Generation - Purpose • Purpose: • Determines the frequency of origins or destinations of trips in each zone by trip purpose, as a function of land uses and household demographics, and other socio-economic factors. • List of household demographic and socio-economic factors that may be related to trip generation. • Locations such as urban, suburban and rural areas • Household income • Household size • Auto ownership
Trip Generation - Models • Models • Development of trip generation models involves the selection of explanatory (independent) variables and a functional form that best explain the variation in the number of trips produced from and attracted to traffic zones • Typical independent variables used include: • Production Models • Demographic and socio-economic variables such as population, dwelling units by type, employed persons, car ownership, median income, distance from central business district (CBD), etc. • Attraction Models • Land use variables such as commercial floor area, number of retail and non-retail employees, industrial floor area, park area, etc.
Trip Generation - Categorization • People undertake trips for different purposes (activities) • Prior to model development, trips are classified into categories • A set of trip generation models is developed for the respective trip categories • Trip purpose classification scheme: • Home, work, work-related, shopping, personal business, eat-meal, school, medical/dental, social visit, recreational, serve child, serve passenger, change mode • Complexity increases with greater number of trip purposes
Trip Generation – Common Trip Type Scheme HOME WORK • Many urban areas use a trip type scheme (e.g., FSUTMS) • Home-based work • Home-based shop • Home-based social-recreation • Home-based other • Non-home based • External-external • External-internal • Truck • Taxi O 1 HB WORK TRIP D D P O P 1 HB TRIP 1 NHB TRIP BANK SHOP A A O D 1 NHB TRIP O D O: Origin D: Destination A: Attraction P: Production A P
Trip Generation – Model Specification • Specification of a model involves two tasks: • Selection of explanatory variables • Selection of functional form of the model • A model may be assumed to be linear: • Y = ao + a1X1 + a2X2 + … + anXn • where Y = trip generation (dependent variable) • X = factors affecting trip generation (independent variables, e.g., land use intensity, nature of development, city character, and locational characteristics, social-economic characteristics, etc.)
Trip Generation – Examples (1) Example 1. For estimating trips leaving a residential area in a weekday morning: X1---Number of households X2---Average household income X3---Average household size X4---Average number of car per household Example 2. For estimating trips entering a shopping area during a weekend: X1 - wholesale and retail employment X2 - service employment X3 - average size of the shopping area
Trip Generation – Examples (2) Dependent Variable Independent Variables Y X1 X2 X3 y1 x11 x21x31 y2 x12 x22x32 y3 x13 x23x33 y4 x14 x24x34 Multiple Regressions a0, a1, a2, a3 Y=a0 + a1X1+ a2X2+ a3X3 X1---Number of households X2---Average household income X3---Average household size X4---Average number of car per household
Trip Generation – Model Estimation Method LEAST SQUARES ESTIMATION (LS): In this method, parameter values are determined so that the sum of squared errors over all observations will be minimized. The error is called a residual and is the difference between the observed value and the predicted value of the dependent variable. Most trip generation models use this method.
Trip Generation – Model Estimation Method Trip-Rate Analysis
Trip Generation – Model Estimation Method Cross-Classification Models
Trip Generation – Model Estimation Method Cross-Classification Models
Trip Distribution – Purpose • To estimate the target-year (future) trip volumes QIJ that interchange between all pairs of zones I and J, where Zone I is the trip-producing and Zone J is the trip-attracting zone of the pair
Trip Distribution – Rationale • All trip-attracting zones J in the study area is in competition with each other to attract trips produced by each zone I • The probability of interchange between zones is directly related to the level of activity in each zone. Everything else being equal, more trips will be attracted by zones that have higher levels of “attractiveness” • Trip interchange is inversely related to the difficulty or impedance (WIJ) associated with getting from one zone to another, which can be measured in terms of cost, distance, time, or any combination thereof • When applying a specific model for predictive purposes, care must be exercised to use the same measure of impedance that was employed to calibrate the model
Trip Distribution – Outcome • The trip table: a matrix showing the number of trips between various zones • The table is also called an Original-Destination or O-D Matrix
Trip Distribution – The Gravity Model (1) • Based on Newton’s law of gravitation that describes the forces governing the interaction between two masses, M1 and M2 separated by a distance r Where k = Newton’s gravitational constant
Trip Distribution –The Gravity Model (2) • In 1955, Alan Voorhies applied this principle to trip distribution Where PI = productions in zone I AJ = attractions in zone J WIJ = impedance associated with getting between zone I & J QIJ = trip interchange between zones I and J (number of trips produced at zone I that are attracted to zone J)
Trip Distribution –Reform the Gravity Model (2) • The parameter k can be eliminated by applying the trip-production balance constraint, which states that the sum over all trip-attracting zones J of the interchange volumes that share I as the trip-producing zone must equal the total productions of zone I.
Trip Distribution –Reform the Gravity Model (2) • Thus, the gravity model can be written as: • The bracket term is the proportion of the trips produced by zone I that will be attracted by zone J in competition with all tip-attracting zones x. • Note that one can multiply all attraction terms by a constant and still get this same result; could use relative attractiveness measures (as opposed to actual attractions) to apply gravity model.
Trip Distribution –Reform the Gravity Model (3) • Gravity model is also written as: Where FIJ = [WIJc]-1, Travel-time (friction) factor or lnFIJ=-clnWIJ • Finally, adding a set of interzonal socioeconomic adjustment factors KIJ Where pIJis the probability that a trip generated by zone I will be attracted by zone J.
Solution of Example 8.3 – The Generation-Distribution Sequence
Solution of Example 8.3 – The Generation-Distribution Sequence
Solution of Example 8.3 – The Generation-Distribution Sequence
Solution of Example 8.3 – The Generation-Distribution Sequence