Download
1 / 17
170 likes | 286 Views
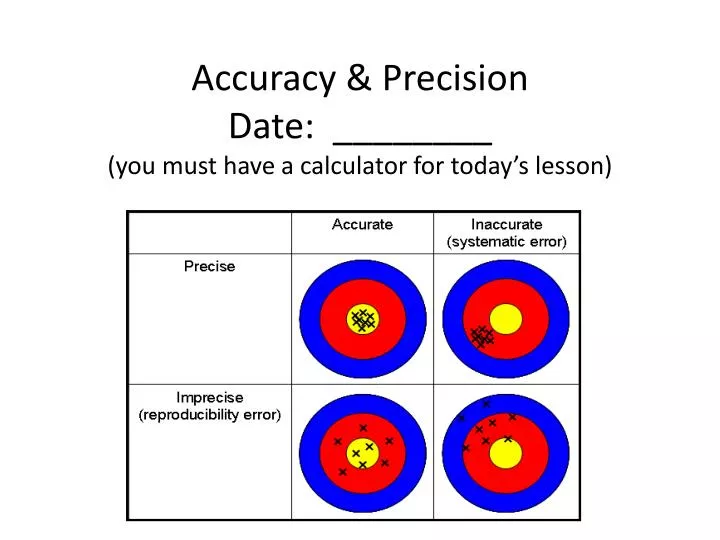
Accuracy & Precision Date: ________ (you must have a calculator for today’s lesson). Accuracy. Closeness of a measurement to an accepted value Accepted value comes from reference materials

E N D
Accuracy & PrecisionDate: ________(you must have a calculator for today’s lesson)
Accuracy • Closeness of a measurement to an accepted value • Accepted value comes from reference materials • The quantitative expression of accuracy is called relative error (in chemistry this may have been called percentage error) and is a %
Relative Error Er = | O – A | x 100 A Er = relative Error O = your observed or calculated value A = the accepted value from reference materials |brackets| = absolute value, so no matter which is the larger number O or A, take the difference and make the result positive.
Let’s practice • In a density experiment, you determine the following for a sample of aluminum; • mass = 15.0 g ; volume = 4.91 cm3 • Reference materials, such as a chemistry text or a trusted science website, will contain an accepted value for the density of aluminum. • A = 2.70 g/cm3 • What is the relative Error of your observed density value?
First you must calculate the density density = mass/volume d = 15.0 g / 4.91 cm3 d = 3.05 g / cm3 Now you can calculate the relative Error Er = | O – A | x 100 A Er = | 2.70-3.05 | g/cm3x 100 2.70 g/cm3 Er = 12.96% but we are limited to 3 significant digits so the answer is 13.0%
You try! Work with your table partner • A sample of lead…..Pb…… what does a good reference source list as the accepted value of density? • http://periodictable.com/Properties/A/Density.html • Your observed values: m= 125g ; V = 11.3 cm3 • What is the relative Error for your data?
Answer • d = 11.1 g/cm3 • Er = 2.11% • If you did not successfully get both of these answers, see me in aclab at 10:15 asap.
Precision • Precision is the closeness of measurements to each other. Some experimental data may not have a accepted value, so you can only express the precision of the data rather than it’s accuracy. • So what do we compare our data to if there is no accepted value?
You compare you data tothe mean (or average) of your data • The quantitative expression of precision is Relative Deviation Dr = | O – M| x 100 M You should notice that this equation is almost identical to the one for Relative Error, what is the difference?
Dr = relative Deviation • O = your observed or calculated value • M = mean or average of your data • The structure of the equation is the same!
Let’s practice • 3 students collect data on an unknown sample and determine the following density values. • Student 1: d= 5.92 g/cm3 • Student 2: d= 6.29 g/cm3 • Student 3: d= 6.01 g/cm3 • What is the relative Deviation of Student 1 density result compared to the entire data set of the three density values?
First calculate the mean • Add the density values and divide by the number of samples • Add the 3 density values then divide by 3: 5.92+6.29+6.01 g/cm3 3 M = 6.07 g/cm3
Now calculate the relative Deviation Dr = | O – M| x 100 M Dr = | 5.92 – 6.07 | g/cm3 x 100 6.07 g/cm3 Dr = 2.47%
General view of precisionEvaluate the range of data Which of the following data sets is more precise? Set 1: 21.4 cm, 26.7 cm, 18.9 cm Set 2: 17.2 cm, 24.6 cm, 25.3 cm
Set 1: 21.4 cm, 26.7 cm, 18.9 cm Set 2: 17.2 cm, 24.6 cm, 25.3 cm • Range: Set 1: 26.7 cm – 18.9 cm = 7.8 cm • Range: Set 2: 25.3 cm – 17.2 cm = 8.1 cm • Therefore Set 1 is more precise since it has a smaller range of data.
You tryWork with your table partner • Data set for measurement of velocity • Student 1: 2.44 m/s • Student 2: 2.89 m/s • Student 3: 3.15 m/s • Student 4: 3.07 m/s Find the relative Deviation for Student 3 data.\ Hint: start with the mean and you are limited to 3 significant figures.
Answer • Mean = 2.89 m/s • Dr = 9.00% • If you were not successful, see me in aclab at 10:15 asap.