Download

1 / 54
540 likes | 550 Views
Auger 2015. Mário Pimenta Lisboa, Oct 2012. High Energy interactions. P(Fe) Air Baryons (leading, net-baryon ≠ 0) π 0 ( π 0 e + e - e + e - … ) π ± ( π ± ν ± if L decay < L int ) K ± , D. …. Shower logitudinal profiles.

E N D
Auger 2015 Mário Pimenta Lisboa, Oct 2012
High Energy interactions P(Fe) Air Baryons(leading, net-baryon ≠ 0) π0(π0 e+e- e+e-…) π ±( π ± ν±if Ldecay< Lint ) K±, D. …
Shower logitudinal profiles e.m. – energy deposit μ – muon production μ e.m.
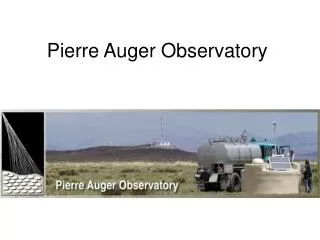
60 km The Pierre Auger Observatory Area ~ 3000 km2 24 fluorescence telescopes South Hemisphere 1600 water Cerenkov detectors Nov 2009 Malargüe, Argentina
Lisboa, Portugal The Pierre Auger Observatory Area ~ 3000 km2 24 fluorescence telescopes South Hemisphere 1600 water Cerenkov detectors
telescope building “Los Leones” LIDAR station communication tower
telescope building “Los Leones” LIDAR station communication tower
E.M. and signal at the SD Individual time traces S/Stot Proton, ϴ =45º , E= 1019 eV , d= 1000m
1-The Xmax X1 Xmax ΔX
Proton cross-section If % p > 20%, % He < 25% Slightly lower than expected by most of the models but in good agreement with recent LHC data.
Xmax distributions As the energy increases the distributions become narrower !!!
γ p Fe <Xmax> and RMS(Xmax)
N - Inclined showers N~ E0.95
Hybrid events N , Eresc EPOS 1.99 QGSJET II
Energy spectrum Ankle p N Δ π g 2.7K GZK like suppression !!!
Energy spectrum (interpretation ) Kotera &Olinto GZK: p γ → →p N Dip (Berezinsky et al) : p γ → p e+ e- Mixed models: fine tuning! Spectrum of UHECRs multiplied by E3 observed by HiRes I and Auger. Overlaid are simulated spectra obtained for different models of the Galactic to extragalactic transition and different injected chemical compositions and spectral indices, s.
Correlation with AGNs 28 out of 84 correlates Vernon-Cetty-Vernon AGN catalog P = 0.006, f = 33 ± 5%
Cen A Closest (4.6 Mpc) powerful radio galaxy with characteristics jets and lobes, candidate for UHECR acceleration E> 57 1018 eV Lower energies No significant anisotropies But particles with the same rigidity (E/Z) follows the same paths !!! scenarios in which high energy anisotropies are caused by heavy primaries and having a significant light component at lower energies are disfavoured
1- The “beam composition” Proton Nuclei ( Iron, …)
<Xmax> and RMS(Xmax) ? Light ? Heavy ?
R.Ulrich If just proton … A dramatic increase in the proton-proton cross section around : Reduced statistics
Grey to black disk Several models … J.Dias de Deus et al. Chiral Symmetry Restoration Percolation J.Dias de Deus et al. G.Farrar et al.
Auger 2015 My vision …
em and profiles Xmax X1 Xmax = X1 + ΔX ΔX em profile N muonic profile E Ne
New analysis methods @ LIP Explore the sensitivity of the first part of the normalized longitudinal shower profile to composition and hadronic interaction models Reconstruct the Muon Production Depth (MPD) from the measured time traces at each SD detectors
New GH parametrization Andringa et al. Astroparticle Physics 34 (2011)360 Gaussian(L) × Distortion(R) • L2 = λ . |X0’| • E (2) . Nmax. L • Could be fixed using Ee.m./Nmax (approx. constant) • R2 = λ / |X0’| • R afects mostly the tails • Should be sensitive to the speed of the shower development R > 0.25 R < 0.25 L > 225 g cm-2 L < 225 g cm-2
Muon ProductionDepth (MPD) L. Cazon, R.A. Vazquez, A.A. Watson, E. Zas, Astropart.Phys.21:71-86 (2004) L.Cazon, PhD Thesis (USC 2005) z Reconstruct the MPD from the measured time traces at each SD detectors t t t
Muon ProductionDepth (MPD) L. Cazon, R.A. Vazquez, A.A. Watson, E. Zas, Astropart.Phys.21:71-86 (2004) L.Cazon, PhD Thesis (USC 2005) z Reconstruct the MPD from the measured time traces at each SD detectors t t t
MARTA MuonAugerRPC TankArray Portugal, Brazil, Spain, USA, Czech Republic, …
Theconcept RPCs under the tanks... µ PMT e 1.20 m To measure with high precision: - Nµ (mean and RMS) - Muon Longitudinal profile (XMAXµ, …)
“autonomous”RPCs Resistive Plate Chambers (RPCs) are rugged and reliable gaseous detectors, widely used in High Energy and Nuclear Physics experiments.- excellent time resolution- can be produced in large areas- cheap External view of the 0.5x1m2 prototype Background current at a gas flow of 1 kg/year of R134a. Generic RPC architecture At a constant temperature the current is stable, demonstrating the operation of the chamber at a very low gas flow. Structure of the prototype
Detailed geant4 simulation StationSimData vector of Particle objects representing the particles that enter the tank. Particle objects representing the particles that entered the RPC gas are added; “weight” is used to store the total ionizing energy deposited in the gas by each particle. 60 cm Acrylic Glass (soda-lime) Gas (C2H2F4) 1.25 cm Gas (C2H2F4)
Outdoor operation with minimum maintenance and sensitivity to the environment • Test conditions: • HV = 5600 V • Gas flow rate, 0.4 cc/min (~1kg/year) • Continuous monitoring (1 sample/s): • Ambient temperature, 1 sensor • Temperature inside box, 3 sensors • RH inside box, 1 sensor • Pressure inside box, 1 sensor • Background current
Readout …. MAROC ASIC Tests RPC signal MAROC digital output MAROC analog sum
We are exploring the 100 TeV energy scale, well beyond LHC, and may be we are touching something fundamental!