Download
1 / 1
10 likes | 136 Views
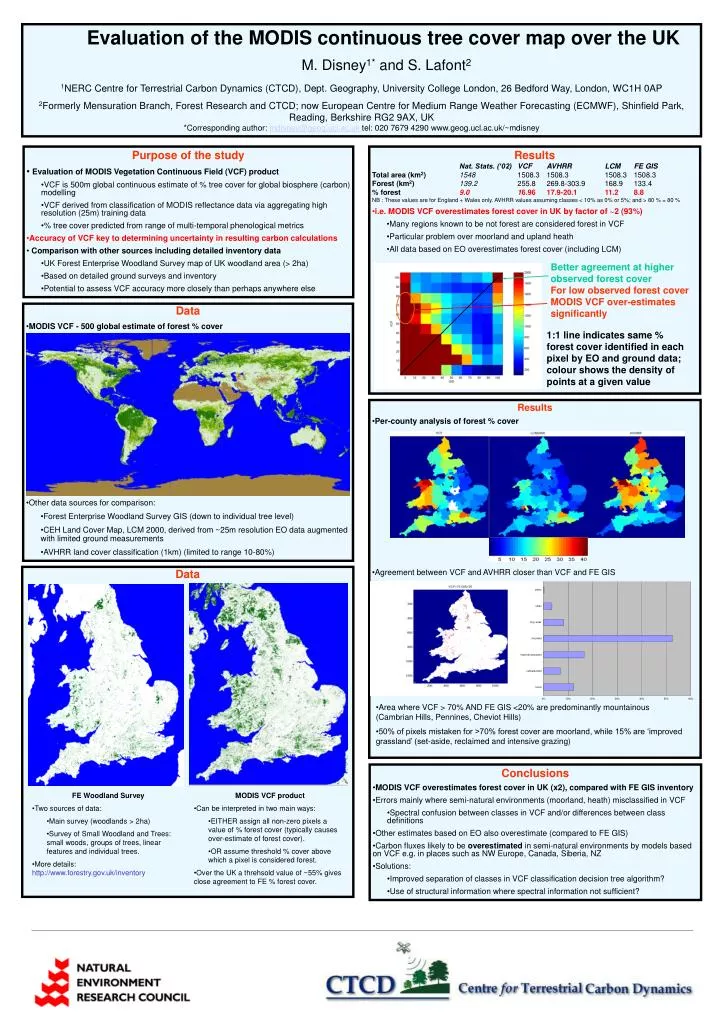
Better agreement at higher observed forest cover For low observed forest cover MODIS VCF over-estimates significantly. 1:1 line indicates same % forest cover identified in each pixel by EO and ground data; colour shows the density of points at a given value.

E N D
Better agreement at higher observed forest cover For low observed forest cover MODIS VCF over-estimates significantly 1:1 line indicates same % forest cover identified in each pixel by EO and ground data; colour shows the density of points at a given value • Evaluation of the MODIS continuous tree cover map over the UK M. Disney1* and S. Lafont2 • 1NERC Centre for Terrestrial Carbon Dynamics (CTCD), Dept. Geography, University College London, 26 Bedford Way, London, WC1H 0AP • 2Formerly Mensuration Branch, Forest Research and CTCD; now European Centre for Medium Range Weather Forecasting (ECMWF), Shinfield Park, Reading, Berkshire RG2 9AX, UK • *Corresponding author: mdisney@geog.ucl.ac.uk tel: 020 7679 4290 www.geog.ucl.ac.uk/~mdisney • Purpose of the study • Evaluation of MODIS Vegetation Continuous Field (VCF) product • VCF is 500m global continuous estimate of % tree cover for global biosphere (carbon) modelling • VCF derived from classification of MODIS reflectance data via aggregating high resolution (25m) training data • % tree cover predicted from range of multi-temporal phenological metrics • Accuracy of VCF key to determining uncertainty in resulting carbon calculations • Comparison with other sources including detailed inventory data • UK Forest Enterprise Woodland Survey map of UK woodland area (> 2ha) • Based on detailed ground surveys and inventory • Potential to assess VCF accuracy more closely than perhaps anywhere else • Results • Nat. Stats. (‘02) VCF AVHRR LCM FE GIS • Total area (km2)1548 1508.3 1508.3 1508.3 1508.3 • Forest (km2)139.2 255.8 269.8-303.9 168.9 133.4 • % forest 9.0 16.96 17.9-20.1 11.2 8.8 • NB : These values are for England + Wales only. AVHRR values assuming classes < 10% as 0% or 5%; and > 80 % = 80 % • i.e. MODIS VCF overestimates forest cover in UK by factor of ~2 (93%) • Many regions known to be not forest are considered forest in VCF • Particular problem over moorland and upland heath • All data based on EO overestimates forest cover (including LCM) • Data • MODIS VCF - 500 global estimate of forest % cover • Other data sources for comparison: • Forest Enterprise Woodland Survey GIS (down to individual tree level) • CEH Land Cover Map, LCM 2000, derived from ~25m resolution EO data augmented with limited ground measurements • AVHRR land cover classification (1km) (limited to range 10-80%) • Results • Per-county analysis of forest % cover • Agreement between VCF and AVHRR closer than VCF and FE GIS Data • Area where VCF > 70% AND FE GIS <20% are predominantly mountainous (Cambrian Hills, Pennines, Cheviot Hills) • 50% of pixels mistaken for >70% forest cover are moorland, while 15% are ‘improved grassland’ (set-aside, reclaimed and intensive grazing) • Conclusions • MODIS VCF overestimates forest cover in UK (x2), compared with FE GIS inventory • Errors mainly where semi-natural environments (moorland, heath) misclassified in VCF • Spectral confusion between classes in VCF and/or differences between class definitions • Other estimates based on EO also overestimate (compared to FE GIS) • Carbon fluxes likely to be overestimated in semi-natural environments by models based on VCF e.g. in places such as NW Europe, Canada, Siberia, NZ • Solutions: • Improved separation of classes in VCF classification decision tree algorithm? • Use of structural information where spectral information not sufficient? • FE Woodland Survey • Two sources of data: • Main survey (woodlands > 2ha) • Survey of Small Woodland and Trees: small woods, groups of trees, linear features and individual trees. • More details: http://www.forestry.gov.uk/inventory • MODIS VCF product • Can be interpreted in two main ways: • EITHER assign all non-zero pixels a value of % forest cover (typically causes over-estimate of forest cover). • OR assume threshold % cover above which a pixel is considered forest. • Over the UK a threhsold value of ~55% gives close agreement to FE % forest cover.