Download
1 / 23
230 likes | 363 Views
Model selection. Best subsets regression. Statement of problem. A common problem is that there is a large set of candidate predictor variables. Goal is to choose a small subset from the larger set so that the resulting regression model is simple , yet have good predictive ability.

E N D
Model selection Best subsets regression
Statement of problem • A common problem is that there is a large set of candidate predictor variables. • Goal is to choose a small subset from the larger set so that the resulting regression model is simple, yet have good predictive ability.
Example: Cement data • Response y: heat evolved in calories during hardening of cement on a per gram basis • Predictor x1: % of tricalcium aluminate • Predictor x2: % of tricalcium silicate • Predictor x3: % of tetracalcium alumino ferrite • Predictor x4: % of dicalcium silicate
Two basic methods of selecting predictors • Stepwise regression: Enter and remove predictors, in a stepwise manner, until no justifiable reason to enter or remove more. • Best subsets regression: Select the subset of predictors that do the best at meeting some well-defined objective criterion.
Why best subsets regression? • If there are p-1 possible predictors, then there are 2p-1possible regression models containing the predictors. • For example, 10 predictors yields 210 = 1024 possible regression models. • A best subsets algorithm determines the best subsets of each size, so that choice of the final model can be made by researcher.
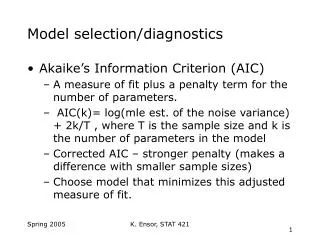
What is used to judge “best”? • R-squared • Adjusted R-squared • MSE (or S = square root of MSE) • Mallow’s Cp
R-squared Use the R-squared values to find the point where adding more predictors is not worthwhile because it leads to a very small increase in R-squared.
Adjusted R-squared or MSE Adjusted R-squared increases only if MSE decreases, so adjusted R-squared and MSE provide equivalent information. Find a few subsets for which MSE is smallest (or adjusted R-squared is largest) or so close to the smallest (largest) that adding more predictors is not worthwhile.
which equals: Mallow’s Cp criterion The goal is to minimize the total standardized mean square error of prediction: which in English is:
Mallow’s Cp criterion Mallow’s Cp statistic estimates • where: • SSEpis the error sum of squares for the fitted (subset) regression model with p parameters. • MSE(X1,…, Xp-1) is the MSE of the model containing all p-1 predictors. It is an unbiased estimator of σ2. • p is the number of parameters in the (subset) model
Facts about Mallow’s Cp • Subset models with small Cpvalues have a small total standardized MSE of prediction. • When the Cp value is … • near p, the bias is small (next to none), • much greater than p, the bias is substantial, • below p, it is due to sampling error; interpret as no bias. • For the largest model with all possible predictors, Cp= p (always).
Using the Cp criterion • So, identify subsets of predictors for which: • the Cp value is smallest, and • the Cp value is near p (if possible) • In general, though, don’t always choose the largest model just because it yields Cp= p.
Best Subsets Regression: y versus x1, x2, x3, x4 Response is y x x x x Vars R-Sq R-Sq(adj) C-p S 1 2 3 4 1 67.5 64.5 138.7 8.9639 X 1 66.6 63.6 142.5 9.0771 X 2 97.9 97.4 2.7 2.4063 X X 2 97.2 96.7 5.5 2.7343 X X 3 98.2 97.6 3.0 2.3087 X X X 3 98.2 97.6 3.0 2.3121 X X X 4 98.2 97.4 5.0 2.4460 X X X X
Stepwise Regression: y versus x1, x2, x3, x4 Alpha-to-Enter: 0.15 Alpha-to-Remove: 0.15 Response is y on 4 predictors, with N = 13 Step 1 2 3 4 Constant 117.57 103.10 71.65 52.58 x4 -0.738 -0.614 -0.237 T-Value -4.77 -12.62 -1.37 P-Value 0.001 0.000 0.205 x1 1.44 1.45 1.47 T-Value 10.40 12.41 12.10 P-Value 0.000 0.000 0.000 x2 0.416 0.662 T-Value 2.24 14.44 P-Value 0.052 0.000 S 8.96 2.73 2.31 2.41 R-Sq 67.45 97.25 98.23 97.87 R-Sq(adj) 64.50 96.70 97.64 97.44 C-p 138.7 5.5 3.0 2.7
Best Subsets Regression: PIQ versus MRI, Height, Weight Response is PIQ H W e e i i M g g R h h Vars R-Sq R-Sq(adj) C-p S I t t 1 14.3 11.9 7.3 21.212 X 1 0.9 0.0 13.8 22.810 X 2 29.5 25.5 2.0 19.510 X X 2 19.3 14.6 6.9 20.878 X X 3 29.5 23.3 4.0 19.794 X X X
Stepwise Regression: PIQ versus MRI, Height, Weight Alpha-to-Enter: 0.15 Alpha-to-Remove: 0.15 Response is PIQ on 3 predictors, with N = 38 Step 1 2 Constant 4.652 111.276 MRI 1.18 2.06 T-Value 2.45 3.77 P-Value 0.019 0.001 Height -2.73 T-Value -2.75 P-Value 0.009 S 21.2 19.5 R-Sq 14.27 29.49 R-Sq(adj) 11.89 25.46 C-p 7.3 2.0
Best Subsets Regression: BP versus Age, Weight, ... Response is BP D u W r S e a P t i t u r A g B i l e g h S o s s Vars R-Sq R-Sq(adj) C-p S e t A n e s 1 90.3 89.7 312.8 1.7405 X 1 75.0 73.6 829.1 2.7903 X 2 99.1 99.0 15.1 0.53269 X X 2 92.0 91.0 256.6 1.6246 X X 3 99.5 99.4 6.4 0.43705 X X X 3 99.2 99.1 14.1 0.52012 X X X 4 99.5 99.4 6.4 0.42591 X X X X 4 99.5 99.4 7.1 0.43500 X X X X 5 99.6 99.4 7.0 0.42142 X X X X X 5 99.5 99.4 7.7 0.43078 X X X X X 6 99.6 99.4 7.0 0.40723 X X X X X X
Stepwise Regression: BP versus Age, Weight, BSA, Duration, Pulse, Stress Alpha-to-Enter: 0.15 Alpha-to-Remove: 0.15 Response is BP on 6 predictors, with N = 20 Step 1 2 3 Constant 2.205 -16.579 -13.667 Weight 1.201 1.033 0.906 T-Value 12.92 33.15 18.49 P-Value 0.000 0.000 0.000 Age 0.708 0.702 T-Value 13.23 15.96 P-Value 0.000 0.000 BSA 4.6 T-Value 3.04 P-Value 0.008 S 1.74 0.533 0.437 R-Sq 90.26 99.14 99.45 R-Sq(adj) 89.72 99.04 99.35 C-p 312.8 15.1 6.4
Best subsets regression • Stat >> Regression >> Best subsets … • Specify response and all possible predictors. • If desired, specify predictors that must be included in every model. (Researcher’s knowledge!) • Select OK. Results appear in session window.