Download

1 / 17
230 likes | 855 Views
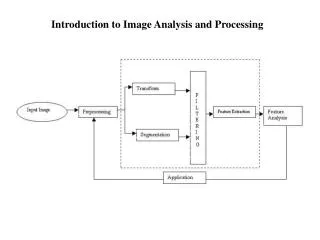
Introduction to Landsat 8 Satellite Image Analysis. Seung Hyun (Lucia) Woo June 20 th , 2013 Yale University. Outline . Negative Reflectance Greater than 1 Reflectance Cyan Pixels Sensor Saturation ENVI Service Pack 3 Calibration Errors Cirrus Band TIR Bands. Landsat 8 vs. Landsat 7.

E N D
Introduction to Landsat 8 Satellite Image Analysis Seung Hyun (Lucia) Woo June 20th, 2013 Yale University
Outline • Negative Reflectance • Greater than 1 Reflectance • Cyan Pixels • Sensor Saturation • ENVI Service Pack 3 • Calibration Errors • Cirrus Band • TIR Bands
Landsat 8 vs. Landsat 7 Coastal Aerosol Cirrus 2 Thermal Bands
Negative Reflectance DN to Reflectance Conversion: Most of the negative reflectance values came from the triangular border regions. White pixels: DN=0 on ALL bands
Negative Reflectance • Recommended Preprocessing Step: Create a mask for DN=0 on ANY band • Even after the mask, some negative pixels remain, notably in the interior of the images. These negative pixels have DN value greater than 0 but less than 5,000. • Highest number of negative reflectivity pixels found in the cirrus band, then the coastal band • Found in areas of low reflectivity. Ex. Bodies of water such as ocean and water channels
Greater than 1 Reflectance • Unlike negative reflectivity, greater than 1 reflectivity is notunnatural 1. Nearby thunderstorm clouds that provide additional illumination from reflected solar radiation 2. The surface receiving radiation is directly perpendicular to the sun. • Most pixels found among cloud pixels - Exception: Occasional white rooftop pixels have>1 reflectivity in the MIR bands
Cyan Cloud Pixels 654 - RGB -Cyan pixels indicate ice. -White pixels indicate liquid droplets.
Sensor Saturation • Dominica: 2013May05_Ref_TOA • For Landsat 8 images, the DN maximum value is 65535, indicating sensor saturation. These pixels are found in the clouds. • Note sensor saturation for Bands 4 and 5 • Curiously, both scenes of Alaska (snow caps) and Florida (thunderstorm clouds) did not demonstrate sensor saturation.
Service Package 3 (SP3) • Automatic Conversion Step (Looked at only reflectance) • Characteristics: - Pixels in the triangular border regions have values of zero on ALL bands - No negative reflectance value. All those negative pixels have values of zero. - Does not incorporate solar angle in its calculations where: ρλ = TOA planetary reflectance, without correction for solar angle. Mρ = Band-specific multiplicative rescaling factor from the metadata (REFLECTANCE_MULT_BAND_x, where x is the band number)Aρ = Band-specific additive rescaling factor from the metadata (REFLECTANCE_ADD_BAND_x, where x is the band number)Qcal = Quantized and calibrated standard product pixel values (DN)θSE = Local sun elevation angle. The scene center sun elevation angle in degrees is provided in the metadata (SUN_ELEVATION). (Source: USGS)
Service Package 3 (SP3) • Near the poles, the absence of solar angle makes a substantial difference (~0.25) in the visible band spectrum. • Ex. Alaska Band Math: B1-B2 B1=Manually calculated TOA with SE B2=SP3 generated TOA
Service Package 3 (SP3) • But, even after taking out the solar angle component, there is a constant offset. • This offset is fortunately small (~0.03). • Note: Mask for DN=0 on ALL bands
Service Package 3 (SP3) • Once the mask for DN=0 on ANY band is applied, the differences between the manual and SP3 calculated reflectance values (still not accounting for solar angle) are almost negligible. • Take Away Points: • Mask for DN=0 on ANY band highly recommended before processing • SP3 is a reliable tool for DN to reflectance conversion IF one disregards solar angle. • For regions close to the poles where solar angles are substantially smaller, one should be cautious to use SP3 reflectance values.
Calibration Errors - Cirrus Band
Calibration Errors - TIR Band Band 10 – TIR 1 (10.60-11.19) Band 11 – TIR 2 (11.50-12.51)
Looking Ahead • Albedo calculations: Liang’s vs. Smith’s • Transects with Cirrus Band (Reflectance, NDVI, Albedo, Temperature) • Coastal Aerosol Band