Download
1 / 19
200 likes | 422 Views
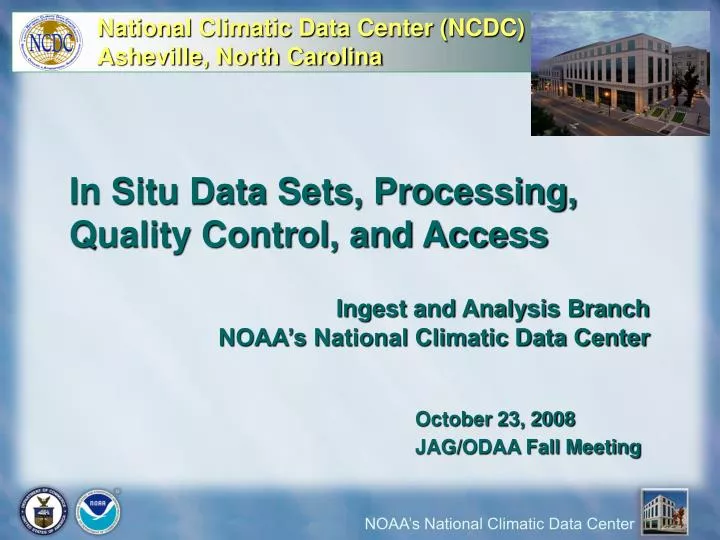
National Climatic Data Center (NCDC) Asheville, North Carolina. In Situ Data Sets, Processing, Quality Control, and Access Ingest and Analysis Branch NOAA’s National Climatic Data Center. October 23, 2008 JAG/ODAA Fall Meeting. NCDC’s Mission. NCDC Mission Statement

E N D
National Climatic Data Center (NCDC) Asheville, North Carolina In Situ Data Sets, Processing, Quality Control, and Access Ingest and Analysis Branch NOAA’s National Climatic Data Center October 23, 2008 JAG/ODAA Fall Meeting
NCDC’s Mission • NCDC Mission Statement • To manage the Nation's resource of global climatological in-situ and remotely sensed data and information to promote global environmental stewardship. • To describe, monitor and assess the climate. • To support efforts to predict changes in the Earth's environment.
Helping to Accomplish the Mission Through the acquisition, quality control, processing, summarization, dissemination, and preservation of a vast array of in situ climatological data generated by the national and international meteorological services. Overview of some key data sets • ASOS: Automated Surface Observing System • COOP: Cooperative Observers Network • CRN: Climate Reference Network • GHCN-Daily: Global Historical Climatology Network-Daily • IGRA: Integrated Global Radiosonde Archive
Two Major Baseline U.S. Data Sets: ASOS and COOP Automated Surface Observing System (ASOS) Network Volunteer Cooperative Observers Network (COOP). Baseline Data Sets: ASOS and COOP
Quality Control of ASOS Data ASOS Daily Acquisition/Processing (Level 1): • ASOS temperatures are received by the minute, hour and day via NOAA satellite broadcasts and telecommunication systems • Hourly and daily data collected from over 900 sites are processed “Unedited” twice daily at NCDC • NCDC performs no quality control on these data (unedited) and places them on-line via the NCDC web (www.ncdc.noaa.gov)Available as soon as possible (within hours) after receipt ASOS End Of Month Automated QC(Level 2): • Final QC processing is done on a monthly time scale • Automated QC for hourly/daily temperature data for 900 sites: Internal consistency checks, climate extremes checks (outliers), and climatology checks (station normals) • Digital database for hourly/daily data created ~ 5 days after EOM
Quality Control of ASOS Data ASOS End Of Month Interactive QC(Level 3): • Local Climatological Data (LCD’s) for ~ 300 sites as defined by the NWS are processed using both automated and interactive processes • Corrections to weather observations received from WFO’s • Comparison with the NWS online F-6 • LCD publication files (.txt and .pdf) are created • These publications (by station) are available on-line 30-45 days after the end of the month (http://www.ncdc.noaa.gov/oa/climate/climatedata.html) • Digital data are available ~30 to 45 days after the end of the month
Quality Control of COOP Data COOP Daily Acquisition/Processing (Level 1): • Data for ~3500 sites are collected shortly after the observations are made and electronically transmitted to NCDC • The COOP data are processed thru automated QC • Internal consistency, climate extremes and climatology checks • Data is placed on the NCDC web site (pseudo forms) COOP Digitally Keyed Data (Level 2): • Forms available for keying 5 to 30 days after a data month • Data is key entered (~ 8000 stations) off site & FTP’d to NCDC where automated quality control is applied • Available within 48 hours of receipt via the NCDC web site COOP End of Month Interactive QC (Level 3): • Final Data available ~75 to 90 days after the data month • COOP temperature validation is ~ 95% automated • Full QC is applied which include automated Internal consistency checks, climate extremes, climatology, and spatial checks
Quality Control of COOP Data: Datzilla DATZILLA • Tool to report, track and resolve errors in NCDC data sets and data access/display/delivery systems. • Web-based system introduced in 2005 that provides users the ability to notify NCDC of possible problems with any data at NCDC • As of 10/2008: • 1200 total error reports • 800 concern NCDC archives • Monitored and problems addressed by a dedicated meteorologist
US Climate Reference Network • NOAA’s Benchmark USA Climate Observing Network • Designed to answer questions about National Temperature & Precipitation changes with the highest confidence • Siting: • 114 CONUS stations at pristine sites; shouldn’t change in >50 years • Instruments: • Triple configuration for temp. & precip. sensors & other measurements • Observations every 5-minutes • Hourly satellite data transmissions • Standards Meet or Exceeds GCOS & CCSP Monitoring Principles • NIST calibration standards Commissioned USCRN stations at CONUS Network build out in 2008
Climate Reference Network Station for National-Level Climate Monitoring Satellite comms 3-wire weighing precipitation gauge with backup gauge inside a large wind fence with single alter. Relative Humidity (in test) Power Control Anemometer Three High-Precision Platinum Resistance Thermometers in Individual Ventilated Radiation Housings Solar Radiation (Pyranometer) Ground Temperature Wetness Sensor Datalogger Soil Moisture & Soil Temperature (in test)
US Climate Reference Network • Data Availability • Hourly and 5-minute data • Available on the NCDC ftp site every hour within 20 minutes of the top of the hour • Hourly representative temperature (avg of last 5 min of the hour) • Hourly temperature average/maximum/minimum • Total hourly precipitation • Hourly solar radiation average/maximum/minimum • Hourly surface temperature average/maximum/minimum • Hourly avg RH, Hourly average soil m/t at 5, 10, 25, 50, 100 cm • Daily and Monthly Summaries • Available as ASCII flat files on the NCDC ftp site in ISD format and updated daily • CRN data also available on the CRN website • http://www.ncdc.noaa.gov/oa/climate/uscrn/
Global Historical Climatology Network – Daily (GHCN) • Global daily in situ dataset derived from multiple sources • ~25,000 temperature stations (Tmax and Tmin) • ~44,000 precipitation stations • ~25,000 snowfall or snowdepth stations • Currently >1.6 billion daily observations • Earliest value from January 2, 1833 • Latest value from yesterday • Serves as the official GCOS Surface Network (GSN) archive
Quality Assurance GHCN-Daily • Each check has been designed and rigorously evaluated using the methodology outlined Durre, Menne and Vose (J. Applied Meteor. Climatol. 2008) in order to minimize the numbers of false positives and misses • Currently about 15 QC checks for temperature, 12 for precipitation, 14 for snowfall, and 12 for snow depth • No check has a false-positive rate of more than 20% (most <10%)—false positive rate for overall system 10% or less (represents the probability that a flagged value is valid) • Total flag rate equal to approximately 0.4% of all values (highest flag rates for snowfall and snowdepth)
Data are updated twice each day All historic sources are “refreshed” weekly Dataset is completely reassembled each week from primary sources to maintain consistency between each component archive and the integrated dataset QC checks are applied to entire period of record with each refresh Updates and Maintenance GHCN-Daily
In situ data from radiosondes Sources: GTS reports and national datasets Parameters Temperature and potential temperature Relative humidity, vapor pressure, and saturation vapor pressure Zonal and meridional wind components Vertical gradients of temperature, potential temperature, relative humidity, and wind components Integrated Global Radiosonde Archive (IGRA)
Integrated Global Radiosonde Archive (IGRA) • 1500+ stations located on global land areas • Duration: 1938 to present • 30 million soundings (>800 million levels) • Most twice-daily • Automated daily via GTS reports • Surface to middle stratosphere • Up to 16 mandatory levels (1000 – 10 hPa) • Surface, tropopause, and significant levels
IGRA: QUALITY ASSURANCE Integrated Global Radiosonde Archive (IGRA) • Basic plausibility • Internal consistency • Repetition of values • Climatological consistency • Data completeness • Temporal/vertical consistency (temperature)
Every day Data updated with all soundings received the previous day Updated dataset placed on NCDC’s FTP site Relevant personnel notified by e-mail of update status Fifth day of each month Monthly means and inventories computed Monthly means placed on NCDC’s FTP site Data sent to the NCDC Archive Inventories sent to the Health of the Network system Updates and Maintenance Integrated Global Radiosonde Archive (IGRA)