Download
1 / 17
220 likes | 543 Views
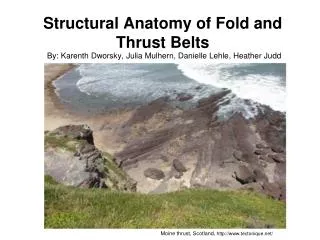
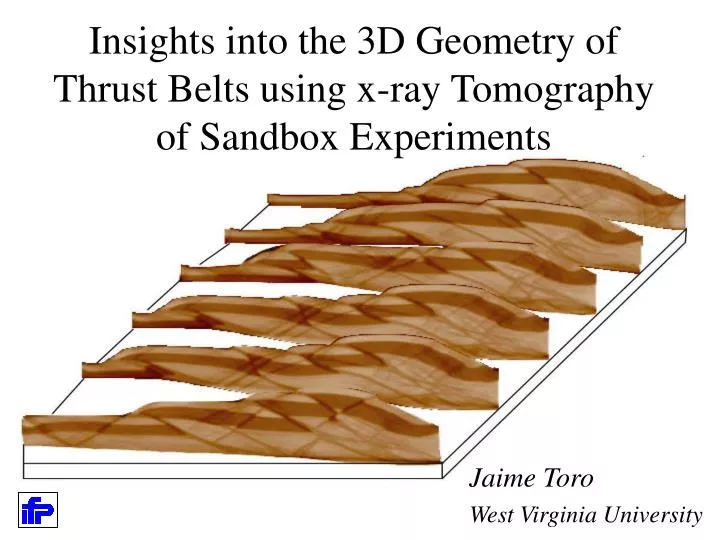
Insights into the 3D Geometry of Thrust Belts using x-ray Tomography of Sandbox Experiments. Jaime Toro West Virginia University. The Data. A stack of 100 x-ray images through the deformed sandbox Acquired at IFP in Rueil-Malmaison, France Also available are slices at intermediate stages.

E N D
Insights into the 3D Geometry of Thrust Belts using x-ray Tomography of Sandbox Experiments Jaime Toro West Virginia University
The Data • A stack of 100 x-ray images through the deformed sandbox • Acquired at IFP in Rueil-Malmaison, France • Also available are slices at intermediate stages
Goals • Understand the relationship between maps and cross sections • Explore the 3D geometry of thrust faults • Think about how shortening is accommodated in different portions of a thrust-belt
Context • After discussing Thrust Systems • After doing conventional sandbox experiments • After some practice with simple cross sections • Before any real field mapping
Vertical Slice (Cross section) Lab Exercise Horizontal Slice though the model (Map View) Vertical Slice (Cross section)
Activities 1: Interpret the Cross Sections 1. Color the two cross sections. 2. Highlight the faults in red.
Activities 2: Make a Geological Map On overlay paper: • 1. Color the stratigraphic units on the map. • 2. Draw contacts • 3. Draw faults with appropriate symbols 4. Anticline and syncline axes. • 5. Strike and dip symbols where possible.
Activities 3: Fault linkage • Label all the faults on the map from west to east using A, B, C, etc. • Put the same fault labels on the cross sections. • Discuss how shortening is partitioned among the faults
E Fault Linkage H A G E A H C D F B D B E H
Activity 3-Mystery sections • Make a new cross section on the basis of your map
Other Insights- Basement Structure Thin cover at north end Thick cover at south end
Other Insights:Deformation Sequence South End
Deformation Movie South End (A-A’)
Deformation Sequence Mystery section- middle slice Final State
Conclusion • 3D Sandbox models are powerful tools for developing intuition about complex structures both in terms of geometry and kinematics.