Download
1 / 24
240 likes | 407 Views
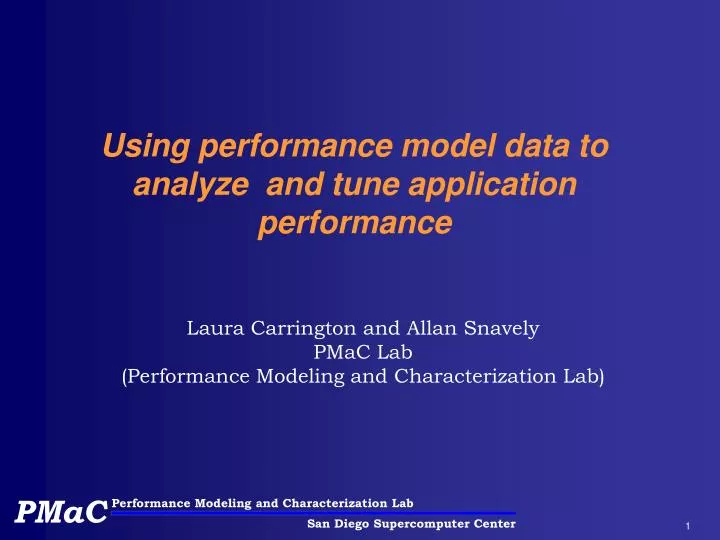
Using performance model data to analyze and tune application performance. Laura Carrington and Allan Snavely PMaC Lab (Performance Modeling and Characterization Lab). Overview. What is the PMaC Lab? What is a performance model? Other usages of performance models

E N D
Using performance model data to analyze and tune application performance Laura Carrington and Allan Snavely PMaC Lab (Performance Modeling and Characterization Lab)
Overview • What is the PMaC Lab? • What is a performance model? • Other usages of performance models • Description of performance prediction framework • Analysis of performance model data for application tuning
PMaC Lab • PMaC Lab works with government agencies and builds performance models for their scientific applications that comprise their workloads. • Models are used in hardware procurement process, hardware upgrade decisions, and analysis of performance bottlenecks of the applications.
What is a Performance Model • Performance model – predicts the execution time of an scientific application on a target system, given a systems attributes (i.e. memory sub-system structure and speed, network structure and speed).
Uses of performance models • Performance models can be used to determine which features of the hardware is the bottleneck in performance and thus where resources (human and financial) should be spent (hardware upgrades or tuning). • Performance models can be used to help guide application tuning – allowing users to hypothetically upgrade a system to determine if the poor scaling or performance is due to the systems hardware (poor network) or the application.
Uses of performance models • Performance model can help determine if your application is achieving its peak performance on a new system (helps determine incorrect compiler flags and system settings). • Performance models can be used to help aid in system procurement for specific workload/application set.
The Performance Prediction Framework • Parallel performance - 2 major factors: • Single processor performance • Use of the network • 2 major components of the framework: • Single processor model Model of application’s performance between communication events • Communication model (Network simulator) Model of application’s communication events
The Performance Prediction Framework • Both models based on simplicity and isolation: • Simplicity: start simple and only add complexity when needed to explain behavior • Isolation: Collect each piece of the performance framework in isolation then combine pieces for performance prediction
Pieces of Performance Prediction Frameworkeach model consists of: • Machine Profile - characterizations of the rates at which a machine can (or is projected to) carry out fundamental operations abstract from the particular application. • Application Signature - detailed summaries of the fundamental operations to be carried out by the application independent of any particular machine. Combine Machine Profile and Application Signature using: • Convolution Methods - algebraic mappings of the Application Signatures on to the Machine profiles to arrive at a performance prediction.
Execution time = operation1operation2operation3 rate op1 rate op2 rate op3 Components of Performance Model Machine Profile: Rate at which a machine can perform different operations collecting: rate op1, op2, op3 Application Signature: Operations needed to be carried out by the application collecting: number of op1, op2, and op3 Convolution: Mapping of a machines performance (rates) to applications needed operations where operator could be + or MAX depending on operation overlap
Exe. time = Memory opFP op Exe. time = comm. op1comm. op2 Mem. rate FP rate op1 rate op2 rate Pieces of Performance Prediction Framework Parallel Processor Prediction Single-Processor Model Communication Model Machine Profile (Machine A) Characterization of memory performance capabilities of Machine A Application Signature (Application B) Characterization of memory operations needed to be performed by Application B Machine Profile (Machine A) Characterization of network performance capabilities of Machine A Application Signature (Application B) Characterization of network operations needed to be performed by Application B Convolution Method Mapping memory usage needs of Application B to the capabilities of Machine A Application B Machine A Convolution Method Mapping network usage needs of Application B to the capabilities of Machine A Application B Machine A Performance prediction of Application B on Machine A
Performance prediction results • Applications: • HYCOM • WRF • AVUS • CTH7 • Overflow2 • Each with 2 different data set sizes • Processor counts: • 32-512 • Number of predictions: • 217 Total avg. absolute rel. error = 12.3 %
Analysis of performance model data • Single processor analysis: • Determine “hotspots” on a fine-grained level and insight into tuning possibilities. • Study affects of processor components on overall runtime to help determine best system to run on. • Sensitivity study • Study effects of network components on overall runtime • Network latency • Network bandwidth • Ports on-off node • Processor layout • Processor performance on computation sections of code
Single-processor analysis: Motivation • More and more applications are memory-bound. • Need a profile of application that : • Identify “hot spots” in fine-grained • Instrumentation to get fine-grained doesn’t affect optimization • Instrumentation is automated • More information about efficiency of memory operations to aid in possible optimization.
Single-processor analysis : Methodology • MetaSim Profiler : • Uses data of existing performance model and components of the PMaC performance prediction framework • Automated instrumentation of binary • Instrumentation does NOT interfere with compiler optimization • Fine-grained memory-based profiler • Fine-grained performance information to aid in optimization decisions
Machine Profile: Rate at which a machine can perform different operations collecting: rate op1, op2, op3 Execution time = operation1operation2operation3 rate op1 rate op2 rate op3 Single-processor analysis : Methodology Application Signature: Operations needed to be carried out by the application collecting: number of op1, op2, and op3 Convolution: Mapping of a machines performance (rates) to applications needed operations where operator could be + or MAX depending on operation overlap • MetaSim Profiler reads in the single-processor application signature data and Machine profile to produce a series of calculated “memory times” based on different performance scenarios for each basic-block of the application • The each scenarios give insight into the memory performance capability of a basic-block. • Result is a table of information about each basic-block of the application (very fine-grained).
Single-processor analysis : Memory performance “scenarios” “memory times” based on performance scenarios such as: • Basic-block’s memory references all performed at stride-one access out of main memory • Basic-Block’s memory references performances based on data location in cache an stride-access (stride-one or random) • Basic-Block’s memory references performance based on data location, stride-access, and dependency factors. • Other scenarios can be calculated but weren’t for this example.
Single-processor analysis : Example memory performance “scenarios” Data for AVUS large at 384 processors MMS1 (Main Memory Stride 1) is memory time assuming all memory references are performed in unit stride. MPC (Main memory with access Pattern and Cache effects) is memory time accounting for location in memory subsystem and access pattern MPCD (Main memory with access Patterns, Cache, and Dependency effects) same as MPC but additionally accounting for dependency • 10415 Performs at MMS1 with no dependency but no benefit from cache • 6556 Could perform at MPC (i.e. data in cache) but performance hit by dependency • 10288 Would perform at MMS1 but performance hit by dependency • 10484 With MPC > MMS1 means random access in loop causing performance hit
Sensitivity Studies • Take existing performance model for a base system and modify network performance in various areas to identify applications performance sensitivities to hardware components (aids in identify performance problems).
Sensitivity Study-AVUS large • Case1: Network lat./2 • Case2: Network BWx2 • Case3: MFLOPS x 2 • Case4: L1 BW x 2 • Case5: L1 & L2 BWx2 • Case6: L1,L2,L3 BWx2 • Case7a: L1,L2,L3,MM • BWx2 • Case7b: L1,L2,L3,MM • BWx2 plus • on-node BWx2 • Case8a: MM BWx2 • Case8b: MM BWx2 • plus • on-node BWx2 • Cache BW has small effect, larger for 384 • Network has insignificant effect
Sensitivity Study-Overflow2 std • Case1: Network lat./2 • Case2: Network BWx2 • Case3: MFLOPS x 2 • Case4: L1 BW x 2 • Case5: L1 & L2 BWx2 • Case6: L1,L2,L3 BWx2 • Case7a: L1,L2,L3,MM • BWx2 • Case7b: L1,L2,L3,MM • BWx2 plus • on-node BWx2 • Case8a: MM BWx2 • Case8b: MM BWx2 • plus • on-node BWx2 • Cache BW has small effect, larger for 384 • Network has insignificant effect
Sensitivity Study-AVUS & Overflow2 • Case1: Network lat./2 • Case2: Network BWx2 • Case3: MFLOPS x 2 • Case4: L1 BW x 2 • Case5: L1 & L2 BWx2 • Case6: L1,L2,L3 BWx2 • Case7a: L1,L2,L3,MM • BWx2 • Case7b: L1,L2,L3,MM • BWx2 plus • on-node BWx2 • Case8a: MM BWx2 • Case8b: MM BWx2 • plus • on-node BWx2 • Cache BW has small effect, larger for 384 • Network has insignificant effect
Sensitivity Study-Overflow2 identifying hardware bottlenecks 2 Base systems : IBM P655 FED and Xeon 3.6 GHz Modify network bandwidth by factor of 2 Modify number of ports off node 1 2 Overflow2 standard 32 Overflow2 standard 128 Indicates that Federation switch is not saturated by this applications communication workload Indicates that communication pattern cause bottleneck getting on and off node
Conclusions • PMaC team can build performance models for applications on existing and future systems. • PMaC team can use performance models to analyze application’s performance to help identify performance bottlenecks, help in tuning applications, and identify those type systems best suited to run the application.