Download
1 / 41
410 likes | 547 Views
ESS 298: OUTER SOLAR SYSTEM. Francis Nimmo. Io against Jupiter, Hubble image, July 1997. Giant Planets. Interiors Composition and phase diagrams Gravimetry / interior structure Heating and energy budget Magnetic fields Formation Rings Atmospheres Structure Dynamics

E N D
ESS 298: OUTER SOLAR SYSTEM Francis Nimmo Io against Jupiter, Hubble image, July 1997
Giant Planets • Interiors • Composition and phase diagrams • Gravimetry / interior structure • Heating and energy budget • Magnetic fields • Formation • Rings • Atmospheres • Structure • Dynamics • Extra-solar planets will be discussed in Week 10
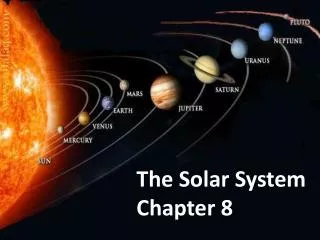
Giant Planets Image not to scale!
Basic Parameters Data from Lodders and Fegley 1998. Surface temperature Ts and radius R are measured at 1 bar level. Magnetic moment is given in 10-4 Tesla x R3.
Compositions (1) • We’ll discuss in more detail later, but briefly: • (Surface) compositions based mainly on spectroscopy • Interior composition relies on a combination of models and inferences of density structure from observations • We expect the basic starting materials to be similar to the composition of the original solar nebula • Surface atmospheres dominated by H2 or He: (Lodders and Fegley 1998)
Interior Structures again • Same approach as for Galilean satellites • Potential V at a distance r for axisymmetric body is given by • So the coefficients J2, J4 etc. can be determined from spacecraft observations • We can relate J2,J4 . . . to the internal structure of the planet
Interior Structure (cont’d) C • Recall how J2 is defined: R • What we would really like is C/MR2 • If we assume that the planet has no strength (hydrostatic), we can use theory to infer C from J2 directly • For some of the Galilean satellites (which ones?) the hydrostatic assumption may not be OK A • Is the hydrostatic assumption likely to be OK for the giant planets? • J4,J6 . . . give us additional information about the distribution of mass within the interior
Results • Densities are low enough that bulk of planets must be ices or compressed gases, not silicates or iron (see later slide) • Values of C/MR2 are significantly smaller than values for a uniform sphere (0.4) and the terrestrial planets • So the giant planets must have most of their mass concentrated towards their centres (is this reasonable?)
Pressure • Hydrostatic approximation • Mass-density relation • These two can be combined (how?) to get the pressure at the centre of a uniform body Pc: • Jupiter Pc=7 Mbar, Saturn Pc=1.3 Mbar, U/N Pc=0.9 Mbar • This expression is only approximate (why?) (estimated true central pressures are 70 Mbar, 42 Mbar, 7 Mbar) • But it gives us a good idea of the orders of magnitude involved
Temperature (1) • If parcel of gas moves up/down fast enough that it doesn’t exchange energy with surroundings, it is adiabatic • In this case, the energy required to cause expansion comes from cooling (and possible release of latent heat); and vice versa • For an ideal, adiabatic gas we have two key relationships: Adiabatic only Always true Here P is pressure, r is density, R is gas constant (8.3 J mol-1 K-1), T is temperature, m is the mass of one mole of the gas, g is a constant (ratio of specific heats, ~ 3/2) • We can also define the specific heat capacity of the gas at constant pressure Cp: • Combining this equation with the hydrostatic assumption, we get:
Temperature (2) • At 1 bar level on Jupiter, T=165 K, g=23 ms-2, Cp~3R, m=0.002kg(H2), so dT/dz = 1.4 K/km (adiabatic) • We can use the expressions on the previous page to derive how e.g. the adiabatic temperature varies with pressure (Here T0,P0 are reference temp. and pressure, and c is constant defined on previous slide) This is an example of adiabatic temperature and density profiles for the upper portion of Jupiter, using the same values as above, keeping g constant and assuming g=1.5 Note that density increases more rapidly than temperature – why? Slope determined by g
Hydrogen phase diagram Hydrogen undergoes a phase change at ~100 GPa to metallic hydrogen (conductive) It is also theorized that He may be insoluble in metallic H. This has implications for Saturn. Interior temperatures are adiabats • Jupiter – interior mostly metallic hydrogen • Saturn – some metallic hydrogen • Uranus/Neptune – molecular hydrogen only
Compressibility & Density • As mass increases, radius also increases • But beyond a certain mass, radius decreases as mass increases. • This is because the increasing pressure compresses the deeper material enough that the overall density increases faster than the mass • The observed masses and radii are consistent with a mixture of mainly H+He (J,S) or H/He+ice (U,N) radius Constant density mass
Summary • Jupiter - mainly metallic hydrogen. Low C/MR2 due to self-compression. Rock-ice core ~10 ME. • Saturn - mix of metallic and molecular hydrogen; helium may have migrated to centre due to insolubility. Mean density lower than Jupiter because of smaller self-compression effect. • Uranus/Neptune – pressures too low to generate metallic hydrogen. Densities and C/MR2 require large rock-ice cores in the interior.
From Guillot, 2004
Magnetic Fields • Jupiter’s originally detected by radio emissions (electrons being accelerated in strong magnetic field – bad for spacecraft!) • Jupiter’s field is ~10o off the rotation axis (useful for detecting subsurface oceans) • Saturn’s field is along the rotation axis • Jupiter’s and Saturn’s fields are mainly dipolar • Uranus and Neptune both have complicated fields which are not really dipolar; the dipolar component is a long way off-axis
How are they generated? • Dynamos require convection in a conductive medium • Jupiter/Saturn – metallic hydrogen (deep) • Uranus/Neptune - near-surface convecting ices (?) • The near-surface convection explains why higher-order terms are more obvious – how?(see Stanley and Bloxham, Nature 2004)
After Hubbard, in New Solar System (1999) All units in W/m2 48 1.4 3.5 14 reflected incident 13.5 0.6 0.6 4.6 8.1 0.3 0.6 2.6 5.4 0.3 2.0 Neptune Jupiter Uranus Saturn Energy budget observations • Incident solar radiation much less than that at Earth • So surface temperatures are lower • We can compare the amount of solar energy absorbed with that emitted. It turns out that there is usually an excess. Why?
Sources of Energy • One major one is contraction – gravitational energy converts to thermal energy. Helium sinking is another. • Gravitational energy of a uniform sphere is • So the rate of energy release during contraction is Where does this come from? e.g.Jupiter is radiating 3.5x10¹⁷ W in excess of incident solar radiation. This implies it is contracting at a rate of 0.4 km / million years • Another possibility is tidal dissipation in the interior. This turns out to be small. • Radioactive decay is a minor contributor.
Puzzles • Why is Uranus’ heat budget so different? • Perhaps due to compositional density differences inhibiting convection at levels deeper than ~0.6Rp(see Lissauer and DePater). May explain different abundances in HCN,CO between Uranus and Neptune atmospheres. • This story is also consistent with generation of magnetic fields in the near-surface region (see earlier slide) • Why is Uranus tilted on its side? • Nobody really knows, but a possible explanation is an oblique impact with a large planetesimal (c.f. Earth-Moon) • This impact might even help to explain the compositional gradients which (possibly) explain Uranus’ heat budget
Rings • Composed of small (mm-m) particles • Generally found inwards of large satellites. Why? • Synchronous point (what happens to satellites inward of here?) • Roche limit (see below) • Gravitational focusing of impactors results in more impacts closer to the planet • Why do we care? • Good examples of orbital dynamics • Origin and evolution linked to satellites • Not volumetrically significant (Saturn’s rings collected together would make a satellite ~100 km in radius)
Roche Limit Ms rs • The satellite experiences a mean gravitational acceleration of GMp/a2 • But the point closest to the planet experiences a bigger acceleration, because it’s closer by a distance Rs (i.e. tides) Mp rp a Rs Rp • The net acceleration of this point is • If the (fluid) satellite is not to break apart, this acceleration has to be balanced by the gravitational attraction of the satellite itself: • This expression is usually rewritten in terms of the densities of the two bodies, and has a numerical constant in it first determined by Roche:
Ring locations (1) Jupiter Saturn Roche limits Roche limits
Ring locations (2) Uranus Neptune Roche limits Roche limits
Things to notice • Roche limit really does seem a good marker for ring edges • Why are some satellites found inwards of the Roche limit and the synchronous point? • All the rings have complex structures (gaps) • Ring behaviour at least partly controlled by satellites: Galileo image of Jupiter’s rings
Ring Particle Size Starlight being occulted by rings; drop in intensity gives information on particle number density • The rings are made of particles (Maxwell). How do we estimate their size? • Eclipse cooling rate • Radar reflectivity • Forward vs. backscattered light • The number density of the particles may be estimated by occultation data (see ) • Ring thickness sometimes controlled by satellites (see previous slide). Typically ~ 0.1 km
Ring Composition • Vis/UV spectra indicate rings are predominantly water ice (could be other ices e.g. methane, but not yet detected) • Some rings show reddening, due to contamination (e.g. dust) or radiation effects Cassini colour-coded UV image; blue indicates more water ice present. Note the sharp compositional variations
~100,000 km Enceladus Main rings Ring Lifetimes • Small grains (micron-size) have lifetimes of ~1 Myr due to drag from plasma and radiated energy • So something must be continuously re-supplying ring material: • Impacts (on satellites) and mutual collisions may generate some • Volcanic activity may also contribute (Io, Enceladus?) E Ring Hubble image of Saturn’s E-ring. Ring is densest and thinnest at Enceladus, and becomes more diffuse further away. This is circumstantial evidence for Enceladus being the source of the ring material. It is also evidence for Enceladus being active.
Why the sharp edges? • Keplerian shear blurs the rings • Particles closer in are going faster • Collisions will tend to smear particles out with time – this will destroy sharp edges and compositional distinctions collision slower faster Satellite • Shepherding satellites • Outer satellite is going slower than particles • Gravitational attraction subtracts energy from particles, so they move inwards; reverse true for inner sat. • So rings keep sharp edges • And gaps are cleared around satellites Keplerian shear Ring particle
Ring/Satellite Interactions Pan opening the Encke division in Saturn’s rings Pandora and Prometheus shepherding Saturn’s F ring
400km Sharp edges (cont’d) • Positions withing the rings which are in resonance with moons tend to show gaps – why? • E.g. the Cassini division (outer edge of Saturn’s B ring) is at a 2:1 resonance with Mimas • Edge of A ring is at a 7:6 resonance with Janus/Epimetheus • Resonances can also lead to waves Waves arising from 5:3 resonance with Mimas. The light and dark patterns are due to vertical oscillations in ring height (right-hand structure) and variations in particle density (left-hand structure)
End of Lecture Thursday’s lecture will be given by Ashwin Vasavada (JPL) Next week will be the start of the computer project
Atmospheric Composition • Escape velocity ve= (2 g r)1/2 (where’s this from?) • Mean molecular velocity vm= (2kT/m)1/2 • Boltzmann distribution – negligible numbers of atoms with velocities > 3 x vm • Molecular hydrogen, 900 K, 3 x vm= 11.8 km/s • Jupiter ve=60 km/s, Earth ve=11 km/s • H has not escaped due to escape velocity (Jeans escape)
Atmospheric Structure (1) • Atmosphere is hydrostatic: • Assume ideal gas, no exchange of heat with the outside (adiabatic) – work done during expansion as pressure decreases is provided by cooling. Latent heat? • Specific heat capacity at constant pressure Cp: • We can combine these two equations to get: or equivalently Why? Here R is the gas constant, mm is the mass of one mole, and RT/gmm is the scale height of the atmosphere (~10 km) which tells you how rapidly pressure increases with depth
Atmospheric Structure (2) • Lower atmosphere (opaque) is dominantly heated from below and will be conductive or convective (adiabatic) • Upper atmosphere intercepts solar radiation and re-radiates it • There will be a temperature minimum where radiative cooling is most efficient; in giant planets, it occurs at ~0.1 bar • Condensation of species will occur mainly in lower atmosphere radiation Temperature (schematic) Theoretical cloud distribution mesosphere 80 K CH4 (U,N only) stratosphere 140 K NH3 ~0.1 bar tropopause clouds 230 K NH3+H2S troposphere adiabat 270 K H2O
Observations • Surface temperatures • Occultation • IR spectra & doppler effects • Galileo probe and SL9 • Clouds and helium a problem
Atmospheric dynamics • Coriolis effect – objects moving on a rotating planet get deflected (e.g. cyclones) • Why? Angular momentum – as an object moves further away from the pole, r increases, so to conserve angular momentum w decreases (it moves backwards relative to the rotation rate) • Coriolis acceleration = 2 w sin(q) • How important is the Coriolis effect? q is latitude is a measure of its importance e.g. Jupiter v~100 m/s, L~10,000km we get ~35 so important
Atmospheric dynamics (2) • Coriolis effect is important because the giant planets rotate so fast • It is this effect which organizes the winds into zones • Diagram of wind bands and velocities