Download
1 / 3
30 likes | 40 Views
That's not something you need to analyze on a weekly basis maybe only quarterly or even annually. But if you create two versions of this cross-channel marketing attribution analysis: one full of contacts / leads, and the other full of opportunities, you can see how effective it is to move prospects through the funnel in your various channels. This analysis basically tells us about the quality of the contacts that were generated.

E N D
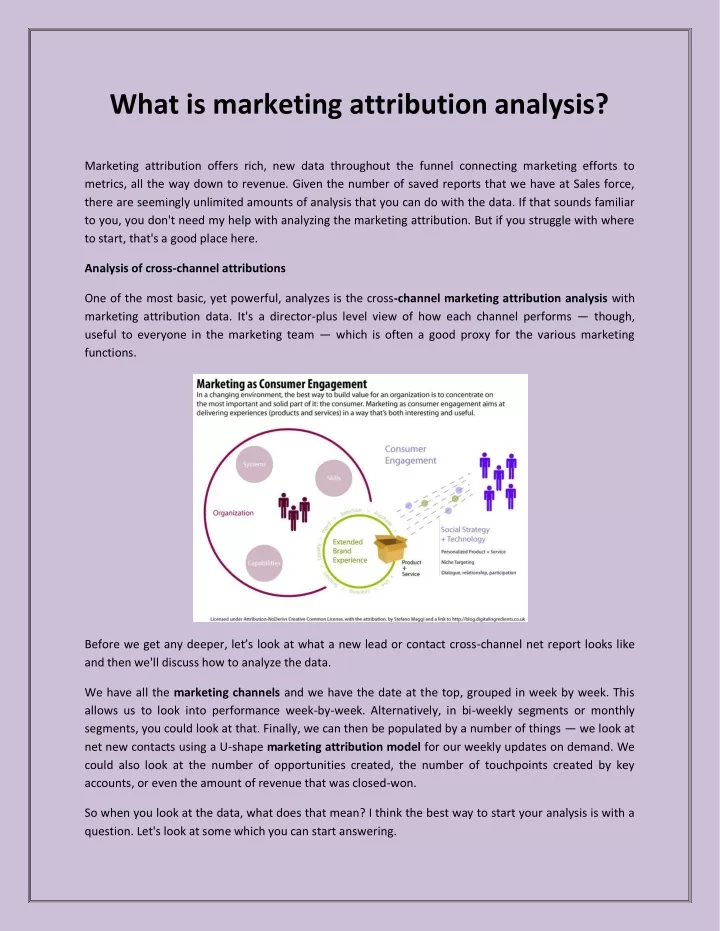
What is marketing attribution analysis? Marketing attribution offers rich, new data throughout the funnel connecting marketing efforts to metrics, all the way down to revenue. Given the number of saved reports that we have at Sales force, there are seemingly unlimited amounts of analysis that you can do with the data. If that sounds familiar to you, you don't need my help with analyzing the marketing attribution. But if you struggle with where to start, that's a good place here. Analysis of cross-channel attributions One of the most basic, yet powerful, analyzes is the cross-channel marketing attribution analysis with marketing attribution data. It's a director-plus level view of how each channel performs — though, useful to everyone in the marketing team — which is often a good proxy for the various marketing functions. Before we get any deeper, let’s look at what a new lead or contact cross-channel net report looks like and then we'll discuss how to analyze the data. We have all the marketing channels and we have the date at the top, grouped in week by week. This allows us to look into performance week-by-week. Alternatively, in bi-weekly segments or monthly segments, you could look at that. Finally, we can then be populated by a number of things — we look at net new contacts using a U-shape marketing attribution model for our weekly updates on demand. We could also look at the number of opportunities created, the number of touchpoints created by key accounts, or even the amount of revenue that was closed-won. So when you look at the data, what does that mean? I think the best way to start your analysis is with a question. Let's look at some which you can start answering.
Are there any changes of the week to the week? First, you want to look for changes from week to week. Have you generated more net new contacts this week than in past weeks? If yes, then what do you do differently? Weeks 2 and 3 are lower than week 1 in our example report but week 4 is the highest. Why is there a dip, and what caused week 4’s eventual rise? Whatever you are looking for is going to depend on the channel. If more leads are generated by your Paid Search channel, have you increased your bids or initiated any new campaigns? If more leads are generated by your Organic Search channel, you could start to rank higher on critical keywords. Or do you do something different about your SEO practices? Once you have identified some areas where you are seeing growth (or a decline), come up with some hypotheses, then dig into channel-specific reports and see if they are holding up. What channels are making the most impact? Next, use this data to see which channels make an impact. Where do you get your demand from? We've seen our demand coming mainly from a handful of marketing attribution channels: paid social, organic searching and partner marketing (which fluctuates quite a bit). Combined with knowing how much we spend on social matters, how much time is spent trying to move the needle on organic search, and how much time spent coordinating partner marketing efforts, we can calculate which channels can be scale- up and worth more investment. Then on the other hand, we can look at the channels that are not driving a lot of demand at the moment such as paid search and offline media. These two analyzes are a great way to get a cross-channel report started. They aren't the only way to look at it though. Quality of contacts generated by each channel That's not something you need to analyze on a weekly basis maybe only quarterly or even annually. But if you create two versions of this cross-channel marketing attribution analysis: one full of contacts / leads, and the other full of opportunities, you can see how effective it is to move prospects through the funnel in your various channels. This analysis basically tells us about the quality of the contacts that were generated. Now, to see the efficiency of each channel we can compare each conversion percentage against the average. Offline media, organic search, and social conversion rates are above average, while events, other and paid search appear to be under performing. With under performing channels, you have to ask yourself the question: are they under performing because we fail to effectively nurture these leads or are they under performing because the channel only produces leads of lesser quality?
Your next steps will tell you the answer to this question. Either you should redevelop the process of nurturing leads coming in via the under performing channels or you should redeploy the budget to a higher performing marketing attribution channel.