Download
1 / 11
110 likes | 234 Views
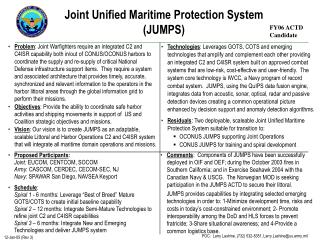
UK Maritime Freight Statistics System. Perspective from Maritime Statistics Branch UK Department for Transport ( DfT ) Jeremy Grove. UK Statistical System.

E N D
UK Maritime Freight Statistics System Perspective from Maritime Statistics Branch UK Department for Transport (DfT) Jeremy Grove
UK Statistical System • Largely decentralised across government departments. Bound together by a common professional group within the civil service, working to a common Code of Practice, overseen by a governing Board which reports (from April 2008) directly to UK Parliament. • Central Office for National Statistics produces many of the main economic and other series, but many other statistics produced in policy departments. • Maritime Statistics are the responsibility of the Department for Transport.
UK Ports Industry • Largest in Europe (584 million tonnes in 2006) • Diverse in size, cargos, organisation • 50+ ports > 1m tonnes, 70+ smaller amounts • Mostly private sector, also trusts and municipal authorities
Top 10 EU (& MSD) ports, 2005 1. Norway is not in the EU but provides data under Directive 95/64/EC
UK organisational structure • Department for Transport (DfT) - responsible for maritime policy and management (including statistics) • Maritime & Coastguard Agency (an agency of DfT) - responsible for marine safety • Maritime industry – e.g. Port Associations (BPA, UKMPG), Chamber of Shipping, seafarer unions
History of UK port traffic statistics • Collection of statistics on port traffic taken over by DfT in 1980. • Data included ‘Mode of appearance’ and simple commodity and route breakdowns • New system needed to meet requirements of EU Maritime Statistics Directive (95/64/EC) – more route and vessel detail • Data collected from ports and sipping lines or agents
Other statistics • Smaller surveys – sea passengers, roro lorries, inland waterways • Fleet – Lloyds Register Fairplay World Fleet database purchased. Used for fleet stats and to link with IMO number in port traffic returns • Ship arrivals – data purchased from LMIU & others • Seafarers – surveys of UK officer, rating & trainee numbers • Port employment & accident rates – survey of ports in 2004, may be updated shortly
Current challenges • Inland origin and destination of port traffic • Commodity detail • Timeliness vs. comprehensiveness • Port capabilities • ‘End to end’ journeys • Employment statistics • Accident and safety statistics
Some applications • Public policy development & debate • Development control • Safety – industry and public • Long term planning • Environment • Contingency planning • Border management
Opportunities • UK Maritime Statistics Advisory Group • SafeSeaNet • AIS • Better data sharing • Eurostat / EMSA / IMSF
Contact details Jeremy Grove Tel: +44 (0)20 7944 4441 email: jeremy.grove@dft.gsi.gov.uk Maritime Statistics Branch Department for Transport Zone 2/29 76 Marsham Street London SW1P 6DR http://www.dft.co.uk/transtat/maritime