Download
1 / 15
150 likes | 305 Views
Reliability Data Collection and Analysis Benbow and Broome (Ch 15, 16 and 17). Presented by Dr. Joan Burtner Certified Quality Engineer Associate Professor of Industrial Engineering and Industrial Management. Overview. Chapter 15 (Collection) Types of data Data sources

E N D
Reliability Data Collection and AnalysisBenbow and Broome (Ch 15, 16 and 17) Presented by Dr. Joan Burtner Certified Quality Engineer Associate Professor of Industrial Engineering and Industrial Management
Overview • Chapter 15 (Collection) • Types of data • Data sources • Collection methods • Management of data • Chapter 16 (Use) • Summarization of data • Preventive and corrective action • Measures of effectiveness • Chapter 17 (Failure analysis tools) • FMEA, FMECA • FTA • FRACAS Dr. Joan Burtner, Associate Professor of Industrial Engineering
Censored Failure Data • Right censored data • Exact failure times collected through the end of the test period • Some items may still be functioning at end of test period • Left censored data • Knowledge that failure happened before a certain time • Occurs when items are not checked prior to testing • Failure is observed at the first examination • Interval censored data • Knowledge that failure happened between 2 times • Occurs when items are checked at intervals (eg. every 2 hrs) • Failure is observed at the first examination Dr. Joan Burtner, Associate Professor of Industrial Engineering
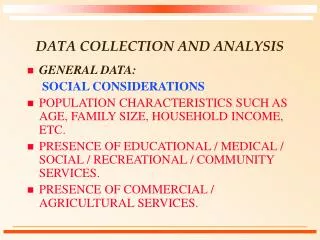
Reliability Data Sources • Laboratory tests before delivery to customer • “Clean” • Unrealistic • Field service data (after delivery to customer) • Difficult to determine relevant factors • Realistic • Provides input for future design changes • Note: Most reliability data collection looks at failure/non-failure. However, effective managers may collect data on degradation of customer satisfaction with non-failed products or processes Dr. Joan Burtner, Associate Professor of Industrial Engineering
Reliability Data Management • Design of the product failure database should involve a variety of stakeholders. • What data will be collected? • Where will the data be kept? • Who will have access to the data? • How long will the data be kept? • What are the backup and security procedures? Dr. Joan Burtner, Associate Professor of Industrial Engineering
Data Summarization • Calculations • Hazard function – failure rate as a function of time λ (t) = Fraction of failures during time period Amount of time during the period • Reliability function – reliability as a function of time R(t) = Number surviving at the end of the time period Number of units tested Dr. Joan Burtner, Associate Professor of Industrial Engineering
Data Presentation • Control Charts • Histograms • Probability density function graphs • Cause and effect diagrams • Scatter diagrams • Pareto charts • Comparisons of before/after preventative or corrective action initiatives Dr. Joan Burtner, Associate Professor of Industrial Engineering
Ch. 17 Tools - FMEA • Failure Mode and Effects Analysis (FMEA) • Purpose: “anticipation and migration of the negative effects of possible failures before they occur.” • Ideally implemented by a cross-functional team that may even include customers • Applicable to all stages from product and process design and through delivery • Includes the development of risk priority values which are subject to interpretation Dr. Joan Burtner, Associate Professor of Industrial Engineering
FMEA Process Steps • Develop team, collect data, identify all possible failure modes. • Calculate risk priority number (rpn) for each mode based on estimations of severity (S), occurrence (O), and detection (D). • Estimations typically range from 1 to 10. • There are many acceptable guidelines for assigning the values. • The rpn for each mode equals S x O x D. • Prioritize failure modes and interpret the results. Dr. Joan Burtner, Associate Professor of Industrial Engineering
FMEA Interpretation • Traditional method: Sort failure modes by rpn number and address modes with highest rpn numbers first. • Because we are dealing with estimations, look for natural groupings rather than absolute ranks. • May use product of severity and detection to break ties. • Alternative method: Do not calculate rpn. Instead, sort by severity rank, then occurrence rank, and finally detection rank. • This allows you to address all of the highest severity failure modes before the medium and lower severity modes. • Regardless of the method used, preventive and corrective action plans should be developed for high priority failure modes. • Thorough documentation is essential. Dr. Joan Burtner, Associate Professor of Industrial Engineering
Ch. 17 Tools - FMECA • Failure Mode and Effects and Criticality Analysis (FMECA) • Purpose same as FMEA • FMECA uses Severity (S) and Occurrence (O) ratings on a scale of 1 to 10, where 10 is highest. • Values are not multiplied. Instead they are placed on a graph with S on x-axis and O on y-axis • Failure modes in the top right quadrant are addressed first. Dr. Joan Burtner, Associate Professor of Industrial Engineering
Ch. 17 Tools – FTA and STA • Fault Tree Analysis (FTA) • Success Tree Analysis (STA) • Graphical representation of identified failure mode • Purpose to help identify root cause of product failure or steps to help ensure product success • See Figure 17.1 (input/output symbols) p.227 • See Figure 17.2 and 6.2 for complete FTA diagrams • See Figure 17.4 STA diagram • Voting OR gate p.228 Dr. Joan Burtner, Associate Professor of Industrial Engineering
Ch. 17 Tools - FRACAS • Failure Reporting, Analysis, and Corrective Action System (FRACAS) • Provides an organized, disciplined approach for dealing with failures that actually occur. • Guidelines for implementing FRACAS • Assign responsibility for FRACAS implementation to individual or department • Require that all failures be reported promptly • Apply FRACAS throughout the product life cycle • Develop timelines for analysis and corrective / preventive actions and reports • Alert next higher level of management WRT non-compliance issues Dr. Joan Burtner, Associate Professor of Industrial Engineering
References • Course Text: • Benbow, D.W. and Broome, H.W., Ed. (2009). The Certified Reliability Engineer Handbook . Milwaukee,WI: ASQ Quality Press. • Additional Sources • Christensen, E.H., Coombes-Betz, K.M., and Stein, M.S. (2006). The Certified Quality Process Analyst Handbook. Milwaukee: ASQ Quality Press. • Westcott, R.T., Ed. (2006). Certified Manager of Quality/Organizational Excellence Handbook (3rd ed.). Milwaukee: ASQ Quality Press. Dr. Joan Burtner, Associate Professor of Industrial Engineering
Contact Information • Email: Burtner_J@Mercer.edu • US Mail: Mercer University School of Engineering 1400 Coleman Avenue Macon, GA • Phone: (478) 301- 4127 Dr. Joan Burtner, Associate Professor of Industrial Engineering