Download
1 / 20
200 likes | 305 Views
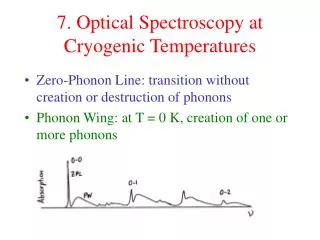
APV settings at cold temperatures. Objective : provide recommendations for APV I2C settings for cold operation, for test beam and eventually CMS Outline : what are the temperature effects and where do they come from?

E N D
APV settings at cold temperatures Objective: provide recommendations for APV I2C settings for cold operation, for test beam and eventually CMS Outline: what are the temperature effects and where do they come from? experimental method used to measure and compensate for T effects recommendations from results of measurements on 4 APV TIB module Mark Raymond, Imperial College CMS Tracker Week
APV bias settings APV analogue chain VPSP VFP VFS IPRE IPCASC IPSF ISSF IPSP ISHA IMUXIN Reference current circuit all analogue bias currents on chip derived from one master reference current (provides reference current to bias gen.) Iref depends on Vt and R (not V250) but Vt and R have T dependence as T↓ , Vt ↑ 1mV / OC R ↓ 0.15% / OC so Iref ↑ (simulation -> 0.233% / OC) CMS Tracker Week
Temperature effects on APV gain T reduces -> master Iref increases -> all I2C bias currents increase -> chip power increases reduce bias currents (I2C parameters beginning with ‘I’) to compensate simple method: adjust each parameter by same factor and round to nearest integer Other T effects T reduces -> m increases=> gm increases => circuit speed increases, pulse shape changes and needs re-tuning APV gain also depends on R at MUX I/P stage, so gain goes up as T reduces CMS Tracker Week
Experimental setup environmental chamber flushed with nitrogen VUTRI card TIB module CMS Tracker Week
Experimental setup Al plate sensor peltier 6 5 hybrid 2 Pt100 temperature sensors 1 peltier hybrid in contact with Al plate (thermal grease) 2 peltier elements cool plate Pt100 sensor measures hybrid temperature (where APVs 3 and 4 would be if 6 chip module) another Pt100 measures Al plate underside temperature hybrid temp. ~3O > Al plate temp. temperature stability ~ ± 2O CMS Tracker Week
Experimental setup peltier 90Sr source Pt100 hybrid in thermal contact with Al plate peltier fan-cooled heatsink scintillator beneath sensor CMS Tracker Week
Method • 1) wait for environment to stabilise at target hybrid temperature • 2) adjust peltier current to fine tune hybrid temperature to target value • 3) tune I2C Ibias parameters to get ~ same V250 and V125 currents as for standard values @ +30O • 4) tune ISHA to achieve close approx. to 50 ns peak mode pulse shape • average of 16 pulse shapes corresponding to one test pulse line • pulse shape tuned “by eye” • not found necessary to alter VFS setting (or VPSP) +30 -20 peak ideal CR-RC decon CMS Tracker Week
Pulse shapes Pulse shapes for all temperatures after tuning for correct power and pulse shape VFS = 70 for all temperatures ICAL=80 in all cases, but output signal amplitude increases as T↓ relative test pulse height dependence on T ICAL derived from master ref. but gain also increases as T↓ so two contributing effects here CMS Tracker Week
Peak & deconvolution pulse shapes ICAL: 0 -> 240 in steps of 40 (1 mip ~ 60 ADC units) CMS Tracker Week
Chip-to-chip variation on this hybrid room temperature measurement – hybrid at 30O same I2C parameters for all 4 chips (including VFS and ISHA) small ICAL response differences here (but absolute value of test charge subject to chip to chip variation) and small pulse shape differences but these chips will have been picked from same wafer (probably same location on wafer) how will pulse shape vary across full production? -> look at wafer probe data CMS Tracker Week
Wafer to wafer pulse shape variation Peak Deconvolution peak and deconvolution mode pulse shapes are acquired for every chip at wafer test time (for same I2C parameters) example data here (presented at LECC’02) for lots 1 to 5 (see http://www.hep.ph.ic.ac.uk/~dmray/pdffiles/APV_LECC02_HEP.pdf) plots show pulse shapes for all KGD normalised to max. pulse height Lot 1 Lot 1 conclusion one set of start-up I2C parameters will suit all chips, at least for a particular module type fine tuning can then follow later Lot 2 Lot 4 Lot 2 Lot 4 Lot 3 Lot 5 Lot 3 Lot 5 CMS Tracker Week
Beta pulse height spectra Peak Mode Deconvolution 90Sr source, sensor HT 250V strip signal included if neighbour signal < 3 x noise S/N values quoted for most probable signal best way to measure gain changes with T gain increase, +30 -> -20 = ~ 7% (7.5% expected from gain resistor) S/N increase: ~13% peak mode, ~8% deconvolution not quite the same but significant errors here (statistics and details of pulse shape) CMS Tracker Week
Beta pulse height spectra Peak Mode Deconvolution CMS Tracker Week
Recommended I2C parameters vs. T all bias current params (those starting with ‘I’) adjusted by same factor to achieve ~ same total module power at each temperature over ~ 10O range power variation small (~ few %) so not necessary to re-tune parameters for variations at this level slight over-adjustment between 0 -> -10 so no further adjustment needed for -20 power/APV = total power / 4 but this also includes APVMUX, DCU and PLL power (not possible to separate out) recommend values in –10O column for CMS operation Note: this doesn’t apply to VPSP, ISHA and VFS. ISHA and VFS will depend on sensor type and some chip to chip variation can also be expected CMS Tracker Week
Digital header amplitude digital header (and tick mark) amplitude varies with T because levels are set by current ref. circuit similar to that for bias generator dig. head amp. CMS Tracker Week
VPSP setting 100% VPSP setting adjusts analogue baseline position works by introducing DC voltage offset at APSP O/P which in turn produces DC offset current flowing in the MUX stages 50% analogue baseline 0 choice of VPSP for this study no major movement in analogue baseline observed with temperature same value (43) used throughout sets baseline at ~ 25% relative to dig. head amp. allows plenty of room for signals and negative CM excursions note: power penalty if set higher than necessary e.g. ~ 7% power increase if move from 25% to 50% level module power baseline pos’n CMS Tracker Week
What happens if no I2C change with T? standard I2C settings used for all temperatures module power increases by ~ 10% (+30 -> - 20) test pulse amplitude increases gm increase in shaper and preamp -> rise-time faster as T decreases deconvolution pulse shape sensitive to rise-time CMS Tracker Week
T measurement using DCU DCU ADC value shows linear dependence on hybrid temperature measured with Pt100 9.65 slope value similar to 9.22 quoted in DCU manual clearly no problem to use DCU to measure hybrid temp. if calibration factor known CMS Tracker Week
Summary recommendations provided for APV I2C settings for low temperature operation based on studies of 4 chip TIB module hybrid temperature used as reference provides starting point for module operation but free parameters still exist VPSP sets analogue baseline. remember power penalty if set high ISHA/VFS tune pulse shape ~ some chip to chip variation will be different for different sensor types results here consistent with previous studies on single chips presented CMS week in Catania (June 2001, E. Noah) note available with more details: http://www.hep.ph.ic.ac.uk/~dmray/pdffiles/cold_APV_params.pdf (preliminary version already circulated) ongoing work verify parameter choice for 6 chip TIB module – expect to be same as 4 chip version look at other module types – old TOB module available CMS Tracker Week
Supply currents vs. T if no I2C change standard I2C settings used for all temperatures I125 shows 16% increase, +40 -> -20 (close to 14% simulated) I250 total includes digital and analogue I250 digital only measured by switching bias off in mode registers small ~ 3.5% increase, +40 -> -20 I250 analogue only = I250 total – I250 digital only ~ 21% increase (> I125 but probably includes some contribution from analogue baseline shift) module power +40 -> -20 1.43 W -> 1.56 W ~ 10% increase but extra power also dissipated in cables CMS Tracker Week