Download
1 / 62
620 likes | 745 Views
The role of environment on galaxy evolution. Michael Balogh. University of Waterloo (Canada). University of Durham. John Mulchaey & Gus Oemler OCIW. Collaborators. Richard Bower , Simon Morris, Dave Wilman No picture: Vince Eke, Cedric Lacey, Fumiaki Nakata Durham.

E N D
The role of environment on galaxy evolution Michael Balogh University of Waterloo (Canada) University of Durham
John Mulchaey & Gus Oemler OCIW Collaborators Richard Bower , Simon Morris, Dave Wilman No picture: Vince Eke, Cedric Lacey, Fumiaki Nakata Durham Bob Nichol, Chris Miller & Alex Gray Carnegie Mellon Baugh, Cole, Frenk (Durham) Ivan Baldry & Karl Glazebrook Johns Hopkins Ray Carlberg Toronto Ian Lewis (Oxford) and the 2dFGRS team No picture: Taddy Kodama
Outline • Background • Low redshift: SDSS and 2dFGRS • GALFORM predictions • Groups and clusters at z~0.5 • Conclusions
Outline • Background • Low redshift: SDSS and 2dFGRS • GALFORM predictions • Groups and clusters at z~0.5 • Conclusions
Morphology-Density Relation E S0 Clusters Spirals Field Dressler 1980
The “Outskirts” of clusters Morphology-Density Relation E S0 Clusters Where does the transition begin, and what causes it? Spirals Field Dressler 1980
Nature or Nurture? • Nature? Elliptical galaxies only form in protoclusters at high redshift. Rest of population is due to infall. • or Nurture? Galaxy evolution proceeds along a different path within dense environments.
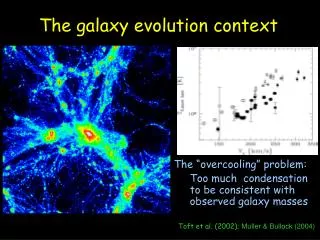
Theoretical expectations (?) • Isolated galaxies have (invisible) halo of hot gas that can cool and replenish the disk • allows star formation to continue for longer • Cluster galaxies lose this gas, so their SFR declines more quickly. Also cluster galaxies form earlier. • therefore SFRs should be lower in clusters • no ram-pressure stripping, harassment needed to achieve reasonable match to observed clusters (Diaferio et al. 2001; Okamoto et al. 2003).
Butcher-Oemler effect • Concentrated clusters at high redshift have more blue galaxies than concentrated clusters at low redshift Butcher & Oemler (1984)
Butcher-Oemler effect • A lot of scatter • appears to be mostly due to correlation with cluster richness • still room to worry about cluster selection? Margoniner et al. (2001)
Butcher-Oemler effect SDSS: Goto et al. (2003) • Many of blue galaxies turned out to have post-starburst spectra (Dressler & Gunn 1992; Couch & Sharples 1987) • Suggested nurture: • ram-pressure stripping (Gunn & Gott 1972) • tidal effects (Byrd & Valtonen 1990) • harassment? (Moore et al. 1999)
But: Field galaxy evolution • But field population also evolves strongly (Lilly et al. 1996) • Post-starburst galaxies equally abundant in the field (Zabludoff et al. 1996; Goto et al. 2003) • So: does BO effect really point to cluster-specific physics, or just the evolving field and infall rate (Ellingson et al. 2001)? Steidel et al. (1999)
Observations: z~0.3 • Strangulation model: • infall rate + assumed decay rate of star formation => radial gradient in SFR • Radial gradients in CNOC clusters suggest t ~2 Gyr Balogh, Navarro & Morris (2000) • higher rate of infall at high redshift leads to steeper gradients Ellingson et al. (2001)
Some remaining questions • Where does the morphology-density relation start? i.e. what environment drives transformations? • What is the timescale for this transformation? e.g. Strangulation (slow) or harassment (fast) • How does SF evolve with time in different environments? Can environment-related transformations drive the Madau plot?
Outline • Background • Low redshift: SDSS and 2dFGRS • GALFORM predictions • Groups and clusters at z~0.5 • Conclusions
2dFGRS and SDSS • 2dFGRS: 250k redshifts, photographic plates • SDSS (DR1): 200k redshifts, digital ugriz imaging • morphology is difficult to quantify • Especially to distinguish E from S0 • use colours and Ha equivalent widths as tracer of SFR • density: • projected distance to 5th nearest neighbour • 3D density based on convolution with Gaussian kernel • cluster velocity dispersion
Median SFR-Density relation R>2R200 Clusters Field Field critical density? 2dFGRS: Lewis et al. 2002 SDSS: Gomez et al. 2003
Ha distribution • Ha distribution shows a bimodality: mean/median of whole distribution can be misleading Balogh et al. 2004
Ha distribution • Ha distribution shows a bimodality: mean/median of whole distribution can be misleading • Isolate star-forming galaxies with W(Ha)>4 Å Balogh et al. 2004
The star-forming population • Amongst the star-forming population, there is no trend in Ha distribution with density • Hard to explain with simple, slow-decay models (e.g. Balogh et al. 2000)
Correlation with density • The fraction of star-forming galaxies varies strongly with density 2dFGRS
Correlation with density • The fraction of star-forming galaxies varies strongly with density • Correlation at all densities; still a flattening near the critical value • Fraction never reaches 100%, even at lowest densities 2dFGRS
Isolated Galaxies • Selection of isolated galaxies: • non-group members, with low densities on 1 and 5.5 Mpc scales • ~30% of isolated galaxies show negligible SF • environment must not be only driver of evolution. All galaxies Bright galaxies
Large scale structure Contours are lines of constant emission-line fraction • Emission-line fraction appears to depend on 1 Mpc scales and on 5.5 Mpc scales. 0.050 r5.5 (Mpc-3) 0.010 0.005 Increasing fraction of Ha emitters 2dFGRS data. Similar results for SDSS r1.1 (Mpc-3)
Colours: SDSS Balogh, Baldry, Nichol, Miller, Bower & Glazebrook, submitted to ApJ Letters
Colour-magnitude relation Sloan DSS data Baldry et al. 2003 (see also Hogg et al. 2003)
Blue Fraction Margoniner et al. 2000 De Propris et al. 2004 (2dFGRS)
Analysis of colours in SDSS data: • Colour distribution in 0.5 mag bins can be fit with two Gaussians • Mean and dispersion of each distribution depends strongly on luminosity • Dispersion includes variation in dust, metallicity, SF history, and photometric errors Bright Faint (u-r) Baldry et al. 2003
24346 galaxies from SDSS DR1. magnitude limited with z<0.08 • density estimates based on Mr<-20 Balogh, Baldry, Nichol, Miller, Bower & Glazebrook, submitted to ApJ Letters
Fraction of red galaxies depends strongly on density. This is the primary influence of environment on the colour distribution. • Density-dependence stronger than luminosity. Bright and faint galaxies show trend with density • Use cluster catalogue of Miller, Nichol et al. (C4 algorithm) • No strong dependence on cluster velocity dispersion observed. Local density is the main driver
Mean colour of distribution is only a weak function of density, but depends strongly on luminosity. Separates internal/external influences • trend may mean galaxies in low-density regions have more recent star formation, on average • but not likely related to large population of red galaxies in clusters
How rapid must the bluered transition be? • colour evolves rapidly if timescale for star formation to stop is short • if transformations occur uniformly in time: • need t<0.5 Gyr • if transformations are more common in the past, longer timescales permitted Red Peak Blue Peak
Summary: SDSS & 2dFGRS • Colour and Ha distributions suggest any transformations must have a short timescale • SFH depends on environment and galaxy luminosity (mass) in a separable way.
Outline • Background • Low redshift: SDSS and 2dFGRS • GALFORM predictions • Groups and clusters at z~0.5 • Conclusions
GALFORM model • GALFORM is Durham model of galaxy formation (Cole et al. 2000) • parameters fixed to reproduce global properties of galaxies at z=0 (e.g. luminosity function) and abundance of SCUBA galaxies at high redshift • Use mock catalogues of 2dFGRS which include all selection biasses • Predict Ha from Lyman continuum photons, choose dust model to match observed Ha distribution • Assume hot gas is stripped from galaxies when they merge with larger halo (i.e. groups and clusters) which leads to strangulation of SFR (gradual decline)
GALFORM predictions • Fraction of SF galaxies declines with increasing density as in data
GALFORM predictions • Over most of the density range, correlation between stellar mass and SFR fraction is invariant • Therefore SFR-density correlation is due to mass-density correlation • At highest densities, models predict fewer SF galaxies at fixed mass due to strangulation
S5<0.2 Mpc-2 S5<0.2 Mpc-2 GALFORM predictions Observed Ha distribution independent of environment at all densities
GALFORM predictions • Fraction of SF galaxies declines with increasing density as in data • At low densities, Ha distribution independent of environment
GALFORM predictions • Fraction of SF galaxies declines with increasing density as in data • At low densities, Ha distribution independent of environment
GALFORM predictions • Fraction of SF galaxies declines with increasing density as in data • At low densities, Ha distribution independent of environment • In densest environments, Ha distribution skewed toward low values
GALFORM predictions: LSS Data Model r5.5 (Mpc-3) r5.5 (Mpc-3) r1.1 (Mpc-3)
GALFORM predictions: LSS Data Model r5.5 (Mpc-3) r5.5 (Mpc-3) r1.1 (Mpc-3)
GALFORM predictions • At low densities, models work very well • - At higher densities, data require more rapid transition than predicted • Fraction of star-forming galaxies depends primarily on local density, but there is a further weak correlation with large scales • - Not expected in CDM models because halo merger history depends only on local environment (Lemson & Kauffmann 1999) • - Should be independently confirmed but suggests an important element missing from these models
Outline • Background • Low redshift: SDSS and 2dFGRS • GALFORM predictions • Groups and clusters at z~0.5 • Conclusions
Evolution - expectations To (over)simplify the issue: • Nature: Evolution in groups, clusters should parallel evolution in the field • Nurture: SFR depends only on environment – so no evolution with redshift
Cluster galaxy evolution 2dF CNOC CNOC clusters: Evolution in SFR different from colour? Suggests high blue fraction at high redshift due to increased infall rate Nakata et al. in prep
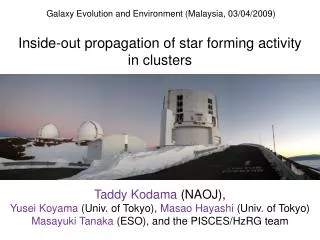
Cluster galaxy evolution z~0.3 z~0.5 Field Field Tresse et al. 2002 Couch et al. 2001 Balogh et al. 2002 Fujita et al. 2003 Complete Ha studies: Even at z=0.5, total SFR in clusters lower than in surrounding field Kodama et al. in prep
Cluster galaxy evolution • Complete Ha based SFR estimates • Evolution in total SFR per cluster not well constrained • considerable scatter of unknown origin • systematic uncertainties in mass estimates make scaling uncertain Finn et al. 2003 Finn et al. 2003 Kodama et al. in prep
Cluster galaxy evolution • Complete Ha based SFR estimates • Evolution in total SFR per cluster not well constrained • considerable scatter of unknown origin • systematic uncertainties in mass estimates make scaling uncertain Finn et al. 2003 Kodama et al. in prep