Download

1 / 12
120 likes | 244 Views
Hood River Basin Study Climate Change Analysis & Application 12SEP2013. Climate Change Conditions. Simulation of climate change conditions mimic procedures and strategies used in other Reclamation studies. Climate Change Dataset CMIP3 Projection Processing Technique

E N D
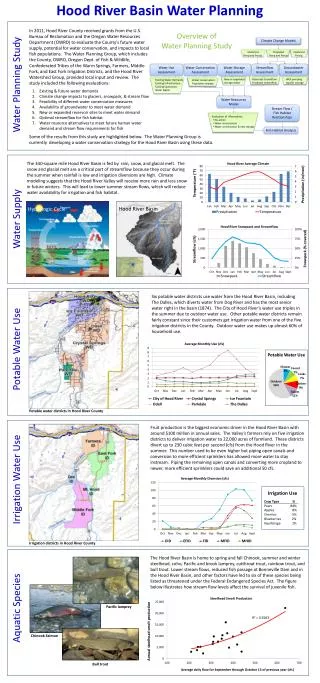
Hood River Basin Study Climate Change Analysis & Application 12SEP2013
Climate Change Conditions • Simulation of climate change conditions mimic procedures and strategies used in other Reclamation studies. • Climate Change Dataset • CMIP3 • Projection Processing Technique • Hybrid Delta Ensemble using 10 projections comparing 1980 – 2009 vs. 2030 – 2059 • Uncertainty Characterization • 20 – 50 – 80 percentiles • Climate Characterization • MW/W, C, and LW/D
CMIP3 Climate Change Data • Period Change between 1980 – 2009 and 2030 – 2059
Projection Selection • 112 GCMs modeled precipitation and temperature from 1950 – 2099 • Ranked GCM outputs based on projected climate change signal
Projected Precipitation: Wet Conditions Precipitation Adjustment Factor -0.3” -1.2” +3.5” +3.0” Jan – Mar Apr – Jun Jul – Sep Oct – Dec Average Precip (inches) 32.3 16.7 6.11 33.0
Projected Precipitation: Dry Conditions -0.6” -0.3” -1.2” +1.0” Precipitation Adjustment Factor Jan – Mar Apr – Jun Jul – Sep Oct – Dec Average Precip (inches) 32.3 16.7 6.11 33.0
Projected Temperature: More Warming Conditions Temperature Adjustment Offset (°C) +2.9°F +2.3°F +3.8°F +2.7°F Jan – Mar Apr – Jun Jul – Sep Oct – Dec Average Temp (°F) 38.8 56.1 64.8 43.0
Projected Temperature: Less Warming Conditions Temperature Adjustment Offset (°C) +1.4°F +1.6°F +2.3°F +1.4°F Jan – Mar Apr – Jun Jul – Sep Oct – Dec Average Temp (°F) 38.8 56.1 64.8 43.0
Climate Change Analysis • Apply adjusted observed data to hydrologic models to assess climate change impacts. • Groundwater model and impacts assessed • MODFLOW: water table, pumping supply, aquifer recharge • Hydrologic model and impacts assessed • DHSVM: glacier, rainfall and snowmelt runoff • Water resource model and impacts assessed • MODSIM: reservoir storage, stream flows, irrigation supply
Questions • Climate Change Dataset • CMIP3 • Projection Processing Technique • Hybrid Delta Ensemble using 10 projections comparing 1980 – 2009 vs. 2030 – 2059 • Uncertainty Characterization • 20 – 50 – 80 percentiles • Climate Characterization • MW/W, C, and LW/D