Download
1 / 30
300 likes | 420 Views
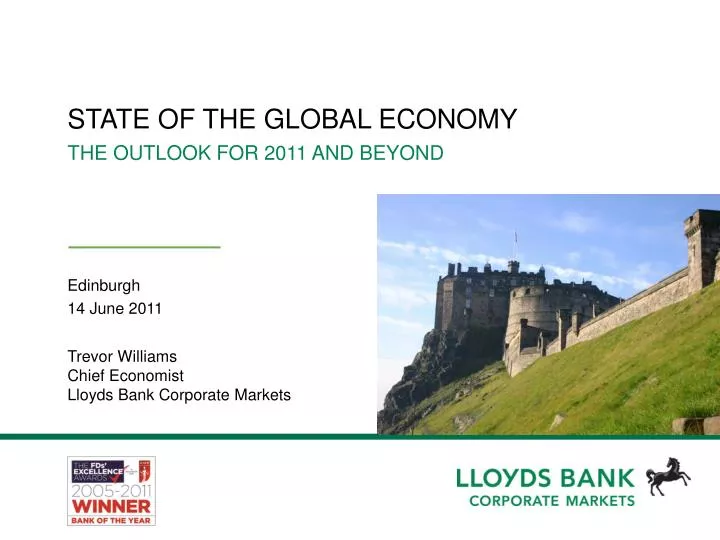
STATE OF THE GLOBAL ECONOMY. THE OUTLOOK FOR 2011 AND BEYOND. Edinburgh 14 June 2011. Summary of global growth forecasts. Source: Lloyds Bank Corporate Markets. US$ per barrel. %, YoY. 300. forecast. 7. forecast. 6. Saudi Arabia oil supply disruption. 250. 5. 4. 200. 3. 150. 2.

E N D
STATE OF THE GLOBAL ECONOMY THE OUTLOOK FOR 2011 AND BEYOND • Edinburgh • 14 June 2011
Summary of global growth forecasts Source: Lloyds Bank Corporate Markets
US$ per barrel %, YoY 300 forecast 7 forecast 6 Saudi Arabia oil supply disruption 250 5 4 200 3 150 2 Base case Saudi oil disruption 1 100 0 -1 50 Base Forecast -2 0 -3 2007 2009 2011 2013 2006 2008 2010 2012 2014 GLOBAL WORST CASE SCENARIO Brent crude oil prices surge to US $250 per barrel as Saudi Arabia is impacted… …World GDP growth slows markedly Source: LBCM
Just when you thought it was safe to get back in the water OTHER RISKS TO THE GLOBAL OUTLOOK • Global imbalances projected to widen • US housing market deteriorates • Commodity price shock • Policy mistake – tighten too fast • China inflation takes off
Russia 4.3% Russia 4.7% Poland 4.0% Poland 4.0% Turkey 6.4% Turkey 6.4% Korea 4.5 Korea 4.5 China 9.4% China 9.1% Mexico 4.6% Mexico 4.6% India 8.0% India 8.3% Indonesia Indonesia 6.1% 6.1% Brazil 5.1% Brazil 5.1% South Africa 4.0% South Africa 4.0% …BUT OUTLOOK STILL LOOKS GOOD… Australia 3.3% Source: LBCM
Rebased, 2007 = 100 104 US 102 100 Euro zone 98 96 UK 94 Japan 92 90 2007 2009 2008 2010 ADVANCED ECONOMIES RECOVERING BUT SLOWLY… Source: OECD, LBCM
Spread over 10yr Bunds 14 Greece 12 Ireland Portugal 10 Spain 8 6 4 2 0 -2 2006 2007 2008 2009 2010 CRISIS IN THE EURO AREA PERIPHERY NOT OVER Source: DataStream
US$ billion Government debt ROW Banks Private & Other US Japan Italy UK France Germany 0 100 200 300 400 500 600 Risks – Euro crisis could have global consequences GLOBAL CONSEQUENCES OF EURO AREA CRISIS World: Bank exposures to peripherals Source: Oxford Economics & BIS
% year 6 forecast 5 4 3 2 1 0 Eurozone debt crisis -1 Greek default -2 Eurozone muddles through -3 2015 2005 2006 2007 2008 2009 2010 2011 2012 2013 2014 WORLD WOULD BE IMPACTED BY SUCH AN EVENT Economic growth • International channels of impact of a default: • Contagion & Confidence – risk appetite, capital flows • Bondholder losses • Bond yields • Wider interbank spreads • Wider lending spreads • Induced fiscal tightening Source: OECD, LBCM
% increase in year, economic growth 6 forecast Germany 4 2 France Euro zone 0 -2 -4 -6 -8 2005 2006 2007 2008 2009 2010 2011 2012 EUROPE: GOOD RECOVERY IN ‘CORE’ Source: LBCM
% increase in year, economic growth 6 forecast 4 Portugal Spain 2 0 -2 -4 Greece -6 Italy -8 2005 2006 2007 2008 2009 2010 2011 2012 EUROPE: WEAK RECOVERY IN ‘PERIPHERAL’ Source: LBCM
% increase in year, CPI inflation 4.5 forecast Euro zone 4.0 3.5 3.0 2.5 Germany 2.0 1.5 1.0 France 0.5 0.0 -0.5 -1.0 2005 2006 2007 2008 2009 2010 2011 2012 RISING INFLATION IN CORE Source: LBCM
FALLING INFLATION IN ‘PERIPHERY’ % increase in year, CPI inflation 6 forecast Greece 5 4 3 2 Spain Italy 1 0 -1 Portugal -2 2005 2006 2007 2008 2009 2010 2011 2012 Source: LBCM
The UK economic outlook Source: LBCM
% change in quarter Q4 2010 Q1 2011 3 1.7 2 1.0 0.9 1 0.5 0.4 0.4 0 -0.3 -0.5 -0.5 -1 -0.6 -2 -1.8 -3 -4 -4.4 -5 GDP Consumer spending Government spending Business investment Net trade Stocks UK ECONOMY HAS BEEN FLAT IN THE LAST SIX MONTHS Source: LBCM
%yr % disp income 180 16 160 14 140 12 120 10 100 8 80 6 Household debt % 60 disposable income (LHS) 4 Household borrowing 40 %yr (RHS) 2 20 0 0 1997 1999 2001 2003 2005 2007 2009 HOUSEHOLDS ARE UNDER PRESSURE Household debt remains uncomfortably high Source: ONS/LBCM
% bal. % q/q 2.0 80 Lloyds Business Barometer (econ. Prospects)(LHS 3m lead) 1.5 60 GDP (RHS) 1.0 40 0.5 20 0.0 0 -0.5 -20 -1.0 -40 -1.5 -60 -2.0 GDP (RHS) -2.5 -80 Jul 07 Jul 08 Jul 09 Jul 06 Jul 10 Jan 09 Jan 11 Jan 08 Jan 10 Jan 06 Jan 07 THE LLOYDS BUSINESS BAROMETER IS GLOOMY Lloyds Barometer suggests that economic recovery to be modest in Q2 Source: Lloyds Bank Corporate Markets
% increase in year % 6 20 5 UK Bank Rate (RHS) 15 4 10 3 5 M4 growth (LHS) 2 0 1 0 -5 2001 2002 2003 2004 2005 2006 2007 2008 2009 2010 2011 …so bank rate may remain on hold for some months yet AND BROAD MONEY SUPPLY GROWTH IS STILL WEAK Source: Lloyds Bank Corporate Markets
Top 10 growth sectors 2011F 2012F Technology Hardware & equipment 7.4% 4.1% Materials 6.2% 3.9% Capital Goods 6.1% 3.0% Pharmaceuticals & biotechnology 5.2% 5.0% Software & services 4.3% 4.6% Business Services 3.8% 4.2% Telecommunication services 3.2% 3.5% Media 3.1% 1.9% Semi-conductor and semiconductor equipment 2.7% 6.7% Banks & diversified financials 1.7% 4.2% Bottom 10 growth sectors 2011F 2012F Energy -1.6% -1.4% Construction 0.2% 1.0% Commercial services 0.4% 1.9% Food & drug retailing 0.4% 2.1% Retailing 0.4% 2.1% Household & personal products 0.5% 3.3% Consumer durables & apparel 1.0% 0.3% Utilities 1.7% 1.8% Insurance 1.6% 3.3% Hotels, restaurants & leisure 1.7% 2.3% WHERE IS GROWTH COMING FROM? Exporters and supporting services lead the way Consumer or government servicing lag Source: Lloyds Bank Corporate Markets
Official interest rate, % % 16 6 forecast Brazil UK 14 5 12 4 10 India Russia 8 3 6 2 ECB China 4 1 2 US 0 0 2004 2005 2006 2007 2008 2009 2010 2011 Dec 06 Dec 07 Dec 08 Dec 09 Dec 10 Dec 11 ECB raising rates Emergers raising rates INTEREST RATE RESPONSES DIFFERENT Source: DataStream/LBCM
£:€ (nominal) £:€ (inflation adjusted 2006) 2.2 £:$ (inflation adjusted 2006) £:$ (nominal) 2 1.8 1.6 1.4 1.2 1 2006 2007 2008 2009 2010 2011 CURRENCIES STILL VOLATILE Source: LBCM
90 250 2006=100 150 80 DAX 30 140 200 70 130 DOW JONES 120 60 Itraxx (RHS) 150 110 50 100 40 90 100 FTSE 100 80 30 70 20 50 60 10 VIX (LHS) NIKKEI 225 50 0 0 40 2006 2007 2008 2009 2010 2011 Jan 11 Jan 10 Jan 06 Jan 07 Jan 08 Jan 09 May 10 May 11 Sept07 May 06 May 07 May 08 May 09 Sept 10 Sept 06 Sept 08 Sept 09 Credit conditions improved but suggest risks Equities have recovered but are volatile ARE MARKETS SETTLED? Source: Lloyds Corporate Markets
% 80 70 India 60 50 40 China US 30 20 Western Europe 10 0 1500 1870 1980 2000 SHIFT IN POWER BACK TO THE EAST Share of world GDP in constant prices Source: Oxford Economics/Maddison
Per Capita $PPP 80,000 $ 50,000 70,000 45,000 60,000 40,000 50,000 35,000 30,000 40,000 25,000 30,000 20,000 20,000 15,000 10,000 10,000 5,000 0 2005 2010 2020 2030 0 2001 2002 2003 2004 2005 2006 Brazil Russia UK India USA China STILL HUGE SCOPE FOR CATCH UP Per capita GDP, as a indicator of personal wealth, is expected to continue to grow... Real Per Capita GDP 2001 - 2006 Forecasted Per Capita GDP 2005 - 2030 …and as people become richer, the demand for retail banking services will increase Source: LBCM
Domestic credit ($2004bn) 50000 40000 30000 20000 10000 0 2004 2009 2014 2019 2024 2029 2034 2039 2044 2049 US China India Japan Germany UK WHAT DOES THIS MEAN FOR RETAIL BANKING? As shown in this slide for the emerging markets giants relative to some developed economies Source: Pricewaterhouse Coopers
% 60 50 Japan 40 EU 30 Russia 20 China Brazil 10 India 0 2005 2008 2011 2014 2017 2020 DEPENDENCY RATIOS RELATIVELY LOW Dependency ratio Source: United Nations
Index (2006=100, quarterly averages) 180 Hong Kong 160 Singapore 140 China(Luxury residential) 120 100 80 60 2000 2001 2002 2003 2004 2005 2006 2007 2008 2009 2010 ‘BUBBLE’ IN ASSET PRICES IN ASIA Emerging Asia: Residential property prices Source: Oxford Economics
Important Notice This presentation does not constitute or imply an offer or commitment whatsoever on the part of Lloyds TSB Bank plc (“Lloyds TSB”). Any such offer may only be made after the negotiation of satisfactory documentation and only after appropriate credit authority has been obtained. The pricing discussed herein is based on our view of current market conditions and is for discussion purposes only. This presentation and all ancillary documents relating to it (together the "Presentation") was prepared by Lloyds TSB exclusively for you for the purpose of analysing certain potential transactions. The Presentation is being made available on a strictly confidential basis to you and is intended only for the internal use of authorised recipients (“Recipients”) and no part of it may be disclosed to any third party. This Presentation and the information contained herein are the property of Lloyds TSB. Recipients are hereby notified that photocopying, scanning, or any other form of reproduction, or distribution - in whole or in part - to any other person at any time is strictly prohibited without the prior written consent of Lloyds TSB. The information in this Presentation reflects prevailing conditions and our judgment as of this date, all of which are subject to change or amendment without notice and the delivery of such amended information at any time does not imply that the information (whether amended or not) contained in this Presentation is correct as of any time subsequent to its date. Whilst Lloyds TSB have exercised reasonable care in preparing this presentation and any views or information expressed or presented are based on sources they believe to be accurate and reliable, neither Lloyds TSB, nor any of their officers, servants, agents, employees or advisors make any representation or warranty, express or implied, as to the fairness, accuracy, adequacy, completeness or correctness of such information, nor as to the achievement or reasonableness of any projections, targets, estimates, or forecasts and nothing in this Presentation should be relied upon as a promise or representation as to the future. Neither Lloyds TSB nor any of their officers, servants, agents, employees or advisors or any affiliate or any person connected with them accepts any liability whatsoever for any direct, indirect or consequential damages or losses arising from any use of this Presentation or its contents or otherwise arising in connection therewith. Lloyds TSB undertakes no obligation to update or correct any information contained herein or otherwise to advise as to any future changes to it. Applicable tax, accounting and legal considerations are subject to change and in all cases independent professional advice should be sought in those areas. This Presentation is provided for information purposes only: there has been no independent verification of the contents of this Presentation. It does not constitute or contain investment advice. It is not and shall not be construed as an offer, invitation, recommendation or solicitation to sell, issue, purchase or subscribe for any securities in any jurisdiction or to enter into any transaction. It is not and shall not be construed as an offer to arrange, underwrite, finance, purchase or sell any security, financial instrument, assets, business, or otherwise provide monies to any party. Such offers may only be provided in writing after satisfactory legal, financial, tax, accounting and commercial due diligence, as well as approval from the relevant business and credit committees of Lloyds TSB and/or their affiliates. The information contained in this Presentation is in summary form for the convenience of presentation and may therefore not be complete. Products and services that may be referenced in the Presentation may be provided through affiliates of Lloyds TSB or any person connected with them. Lloyds TSB and their affiliates prohibits employees from offering a favourable research rating or specific price target or changing a rating or target to get a mandate and Lloyds TSB and their affiliates prohibit research analysts from being compensated for involvement in investment banking transactions, except to the extent that such participation is intended to benefit investor clients. Lloyds TSB, their affiliates, their respective directors or officers or persons connected with them may have an interest in any financial instrument mentioned in this Presentation. Lloyds Bank Corporate Markets is a trading name of Lloyds TSB. Lloyds TSB’s registered office is 25 Gresham Street, London EC2V 7HN and it is registered in England and Wales under No. 2065. Lloyds TSB is authorised and regulated in the United Kingdom by the Financial Services Authority. LLOYDS CORPORATE MARKETS Lloyds Bank Corporate Markets is a trading name of Lloyds TSB Bank plc, which is part of the Lloyds Banking Group. Lloyds TSB Bank plc is authorised and regulated by the Financial Services Authority and a signatory to the Banking Codes. Lloyds TSB Bank plc: Registered Office: 25 Gresham Street, London EC2V 7HN. Registered in England and Wales. Registered No. 2065. BANK OF SCOTLAND Bank of Scotland Treasury is a division of Bank of Scotland plc, which is part of the Lloyds Banking Group. Bank of Scotland plc is authorised and regulated by The Financial Services Authority and a signatory to the Banking Codes. Bank of Scotland plc: Registered Office: The Mound Edinburgh EH1 1YZ. Registered in Scotland. Registered No. SC 327000.