Download
1 / 1
30 likes | 167 Views
Principal components analysis (PCA) as a tool for identifying EEG frequency bands: I. Methodological considerations and preliminary findings Jürgen Kayser 1 , Craig E. Tenke 1 , and Stefan Debener 2 1 Department of Biopsychology, New York State Psychiatric Institute, New York

E N D
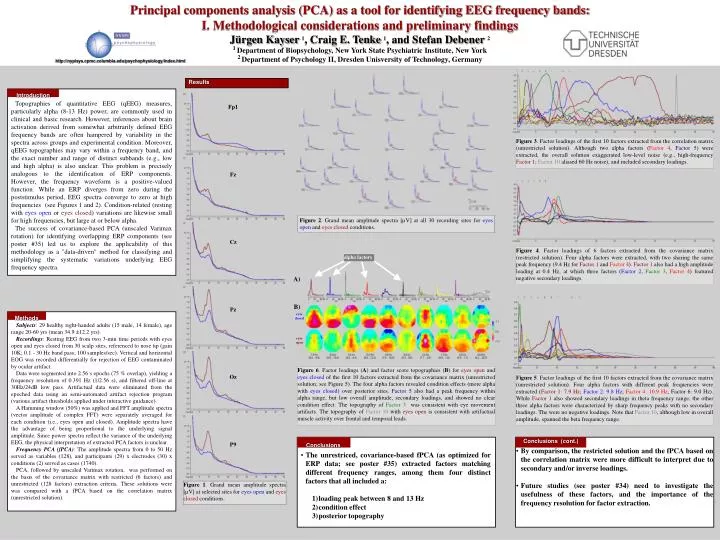
Principal components analysis (PCA) as a tool for identifying EEG frequency bands: I. Methodological considerations and preliminary findings Jürgen Kayser 1, Craig E. Tenke 1, and Stefan Debener 2 1Department of Biopsychology, New York State Psychiatric Institute, New York 2Department of Psychology II, Dresden Unisversity of Technology, Germany http://nypisys.cpmc.columbia.edu/psychophysiology/index.html Topographies of quantitative EEG (qEEG) measures, particularly alpha (8-13 Hz) power, are commonly used in clinical and basic research. However, inferences about brain activation derived from somewhat arbitrarily defined EEG frequency bands are often hampered by variability in the spectra across groups and experimental condition. Moreover, qEEG topographies may vary within a frequency band, and the exact number and range of distinct subbands (e.g., low and high alpha) is also unclear. This problem is precisely analogous to the identification of ERP components. However, the frequency waveform is a positive-valued function. While an ERP diverges from zero during the poststimulus period, EEG spectra converge to zero at high frequencies (see Figures 1 and 2). Condition-related (resting with eyes open or eyes closed) variations are likewise small for high frequencies, but large at or below alpha. The success of covariance-based PCA (unscaled Varimax rotation) for identifying overlapping ERP components (see poster #35) led us to explore the applicability of this methodology as a "data-driven" method for classifying and simplifying the systematic variations underlying EEG frequency spectra. Introduction Results Fp1 Figure 3. Factor loadings of the first 10 factors extracted from the correlation matrix (unrestricted solution). Although two alpha factors (Factor 4, Factor 5) were extracted, the overall solution exaggerated low-level noise (e.g., high-frequency Factor 1; Factor 10 aliased 60 Hz noise), and included secondary loadings. Fz Figure 2. Grand mean amplitude spectra [µV] at all 30 recording sites for eyes open and eyes closed conditions. Figure 4. Factor loadings of 6 factors extracted from the covariance matrix (restricted solution). Four alpha factors were extracted, with two sharing the same peak frequency (9.4 Hz for Factor 1 and Factor 4). Factor 1 also had a high amplitude loading at 0.4 Hz, at which three factors (Factor 2, Factor 3, Factor 4) featured negative secondary loadings. Cz alpha factors A) Methods Subjects: 29 healthy right-handed adults (15 male, 14 female), age range 20-60 yrs (mean 34.9 ±12.2 yrs). Recordings: Resting EEG from two 3-min time periods with eyes open and eyes closed from 30 scalp sites, referenced to nose tip (gain 10K; 0.1 - 30 Hz band pass; 100 samples/sec). Vertical and horizontal EOG was recorded differentially for rejection of EEG contaminated by ocular artifact. Data were segmented into 2.56 s epochs (75 % overlap), yielding a frequency resolution of 0.391 Hz (1/2.56 s), and filtered off-line at 30Hz/24dB low pass. Artifactual data were eliminated from the epoched data using an semi-automated artifact rejection program (various artifact thresholds applied under interactive guidance). A Hamming window (50%) was applied and FFT amplitude spectra (vector amplitude of complex FFT) were separately averaged for each condition (i.e., eyes open and closed). Amplitude spectra have the advantage of being proportional to the underlying signal amplitude. Since power spectra reflect the variance of the underlying EEG, the physical interpretation of extracted PCA factors is unclear. Frequency PCA (fPCA): The amplitude spectra from 0 to 50 Hz served as variables (128), and participants (29) x electrodes (30) x conditions (2) served as cases (1740). PCA, followed by unscaled Varimax rotation, was performed on the basis of the covariance matrix with restricted (6 factors) and unrestricted (128 factors) extraction criteria. These solutions were was compared with a fPCA based on the correlation matrix (unrestricted solution). B) eyes closed Pz eyes open Figure 5. Factor loadings of the first 10 factors extracted from the covariance matrix (unrestricted solution). Four alpha factors with different peak frequencies were extracted (Factor 1: 7.9 Hz; Factor 2: 9.8 Hz; Factor 4: 10.9 Hz, Factor 6: 9.0 Hz). While Factor 1 also showed secondary loadings in theta frequency range, the other three alpha factors were characterized by sharp frequency peaks with no secondary loadings. The were no negative loadings. Note that Factor 10, although low in overall amplitude, spanned the beta frequency range. Figure 6. Factor loadings (A) and factor score topographies (B) for eyes open and eyes closed of the first 10 factors extracted from the covariance matrix (unrestricted solution; see Figure 5). The four alpha factors revealed condition effects (more alpha with eyes closed) over posterior sites. Factor 5 also had a peak frequency within alpha range, but low overall amplitude, secondary loadings, and showed no clear condition effect. The topography of Factor 3 was consistent with eye movement artifacts. The topography of Factor 10 with eyes open is consistent with artifactual muscle activity over frontal and temporal leads. Oz Conclusions • The unrestriced, covariance-based fPCA (as optimized for ERP data; see poster #35) extracted factors matching different frequency ranges, among them four distinct factors that all included a: • loading peak between 8 and 13 Hz • condition effect • posterior topography • By comparison, the restricted solution and the fPCA based on the correlation matrix were more difficult to interpret due to secondary and/or inverse loadings. • Future studies (see poster #34) need to investigate the usefulness of these factors, and the importance of the frequency resolution for factor extraction. Conclusions (cont.) P9 Figure 1. Grand mean amplitude spectra [µV] at selected sites for eyes open and eyes closed conditions.