Download
1 / 15
150 likes | 246 Views
Normal Random Variables. Lecture XII. Univariate Normal Distribution. Definition 5.2.1. The normal density is given by When X has the above density, we write symbolically X ~ N ( m , s 2 ). Mean and Variance of Normal Distribution.

E N D
Normal Random Variables Lecture XII
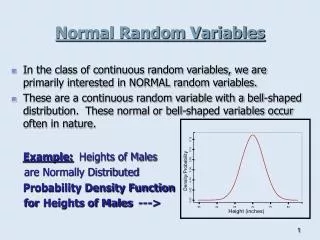
Univariate Normal Distribution. • Definition 5.2.1. The normal density is given by • When X has the above density, we write symbolically X~N(m,s2).
Mean and Variance of Normal Distribution • Theorem 5.2.1. Let X be distributed N(m,s2). Then E[X]= m and V[X]= s2
The first term of the integration by parts is clearly zero while the second is defined by polar integral. Thus,
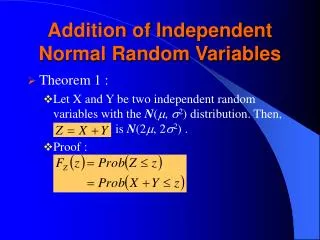
Normality of a Linear Transformation • Theorem 5.2.2. Let X be distributed N(m,s2) and let Y=a+bX. Then we have Y~N(a+bm,b2s2). • This theorem can be demonstrated using Theorem 3.6.1 (the theorem on changes in variables):
Note that probabilities can be derived for any normal based on the standard normal integral. Specifically, in order to find the probability that X~N(10,4) lies between 4 and 8 (P[4<X<8]) implies:
Thus, the equivalent boundary becomes where z is a standard normal variable. These values can be found in a standard normal table as P[z<-1]=.1587 and P[z<-3]=.0013.
As a first step, I want to graph two distributions with the same mean and variance. • I want to start with a binomial distribution with probability .5 and 20 draws. • This distribution has a mean of 10 and a variance of 5.