Download
1 / 1
10 likes | 120 Views
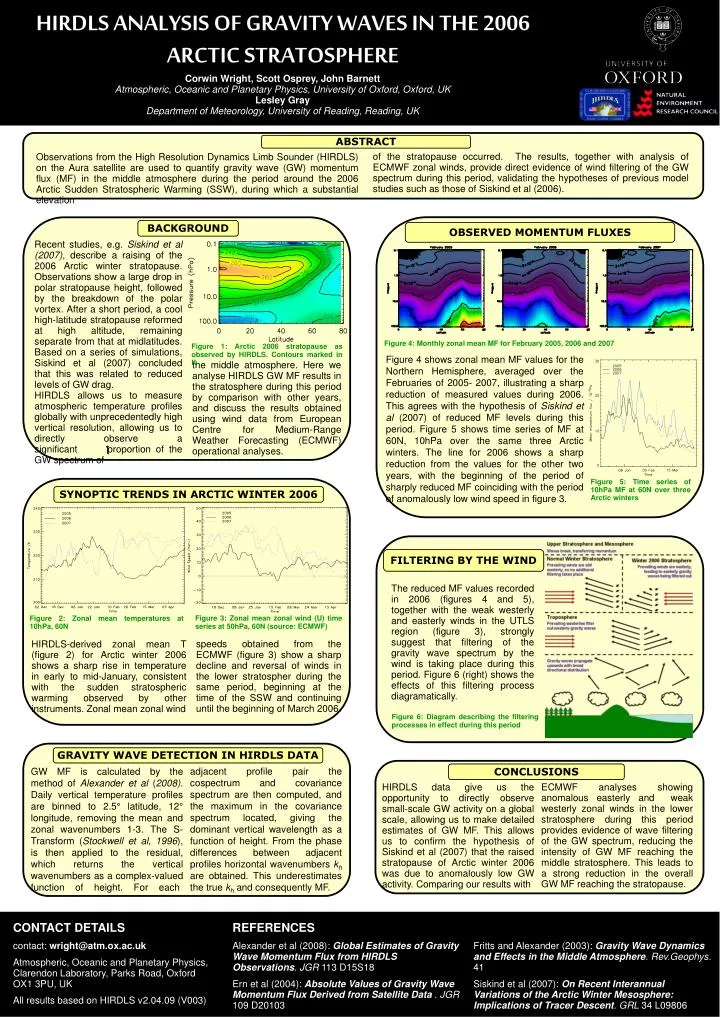
HIRDLS ANALYSIS OF GRAVITY WAVES IN THE 2006 ARCTIC STRATOSPHERE. Corwin Wright, Scott Osprey, John Barnett Atmospheric, Oceanic and Planetary Physics, University of Oxford, Oxford, UK Lesley Gray Department of Meteorology, University of Reading, Reading, UK. ABSTRACT.

E N D
HIRDLS ANALYSIS OF GRAVITY WAVES IN THE 2006 ARCTIC STRATOSPHERE Corwin Wright, Scott Osprey, John Barnett Atmospheric, Oceanic and Planetary Physics, University of Oxford, Oxford, UK Lesley Gray Department of Meteorology, University of Reading, Reading, UK ABSTRACT of the stratopause occurred. The results, together with analysis of ECMWF zonal winds, provide direct evidence of wind filtering of the GW spectrum during this period,validating the hypotheses of previous model studies such as those of Siskind et al (2006). Observations from the High Resolution Dynamics Limb Sounder (HIRDLS) on the Aura satellite are used to quantify gravity wave (GW) momentum flux (MF) in the middle atmosphere during the period around the 2006 Arctic Sudden Stratospheric Warming (SSW), during which a substantial elevation SYNOPTIC TRENDS IN ARCTIC WINTER 2006 FILTERING BY THE WIND The reduced MF values recorded in 2006 (figures 4 and 5), together with the weak westerly and easterly winds in the UTLS region (figure 3), strongly suggest that filtering of the gravity wave spectrum by the wind is taking place during this period. Figure 6 (right) shows the effects of this filtering process diagramatically. Figure 3: Zonal mean zonal wind (U) time series at 50hPa, 60N (source: ECMWF) Figure 2: Zonal mean temperatures at 10hPa, 60N speeds obtained from the ECMWF (figure 3) show a sharp decline and reversal of winds in the lower stratospher during the same period, beginning at the time of the SSW and continuing until the beginning of March 2006. HIRDLS-derived zonal mean T (figure 2) for Arctic winter 2006 shows a sharp rise in temperature in early to mid-January, consistent with the sudden stratospheric warming observed by other instruments. Zonal mean zonal wind Figure 6: Diagram describing the filtering processes in effect during this period • CONTACT DETAILS contact: wright@atm.ox.ac.uk Atmospheric, Oceanic and Planetary Physics, Clarendon Laboratory, Parks Road, Oxford OX1 3PU, UK All results based on HIRDLS v2.04.09 (V003) REFERENCES Alexander et al (2008): Global Estimates of Gravity Wave Momentum Flux from HIRDLS Observations. JGR 113 D15S18 Ern et al (2004): Absolute Values of Gravity Wave Momentum Flux Derived from Satellite Data. JGR 109 D20103 Fritts and Alexander (2003): Gravity Wave Dynamics and Effects in the Middle Atmosphere. Rev.Geophys. 41 Siskind et al (2007): On Recent Interannual Variations of the Arctic Winter Mesosphere: Implications of Tracer Descent.GRL 34 L09806 BACKGROUND OBSERVED MOMENTUM FLUXES Recent studies, e.g. Siskind et al(2007), describe a raising of the 2006 Arctic winter stratopause. Observations show a large drop in polar stratopause height, followed by the breakdown of the polar vortex. After a short period, a cool high-latitude stratopause reformed at high altitude, remaining separate from that at midlatitudes. Based on a series of simulations, Siskind et al (2007) concluded that this was related to reduced levels of GW drag. HIRDLS allows us to measure atmospheric temperature profiles globally with unprecedentedly high vertical resolution, allowing us to directly observe a significant proportion of the GW spectrum of Figure 4: Monthly zonal mean MF for February 2005, 2006 and 2007 Figure 1: Arctic 2006 stratopause as observed by HIRDLS. Contours marked in K Figure 4 shows zonal mean MF values for the Northern Hemisphere, averaged over the Februaries of 2005- 2007, illustrating a sharp reduction of measured values during 2006. This agrees with the hypothesis of Siskind et al (2007) of reduced MF levels during this period. Figure 5 shows time series of MF at 60N, 10hPa over the same three Arctic winters. The line for 2006 shows a sharp reduction from the values for the other two years, with the beginning of the period of sharply reduced MF coinciding with the period of anomalously low wind speed in figure 3. the middle atmosphere. Here we analyse HIRDLS GW MF results in the stratosphere during this period by comparison with other years, and discuss the results obtained using wind data from European Centre for Medium-Range Weather Forecasting (ECMWF) operational analyses. Figure 5: Time series of 10hPa MF at 60N over three Arctic winters GRAVITY WAVE DETECTION IN HIRDLS DATA CONCLUSIONS adjacent profile pair the cospectrum and covariance spectrum are then computed, and the maximum in the covariance spectrum located, giving the dominant vertical wavelength as a function of height. From the phase differences between adjacent profiles horizontal wavenumbers kh are obtained. This underestimates the true kh and consequently MF. GW MF is calculated by the method of Alexanderet al (2008). Daily vertical temperature profiles are binned to 2.5° latitude, 12° longitude, removing the mean and zonal wavenumbers 1-3. The S-Transform (Stockwell et al, 1996),is then applied to the residual, which returns the vertical wavenumbers as a complex-valued function of height. For each ECMWF analyses showing anomalous easterly and weak westerly zonal winds in the lower stratosphere during this period provides evidence of wave filtering of the GW spectrum, reducing the intensity of GW MF reaching the middle stratosphere. This leads to a strong reduction in the overall GW MF reaching the stratopause. HIRDLS data give us the opportunity to directly observe small-scale GW activity on a global scale, allowing us to make detailed estimates of GW MF. This allows us to confirm the hypothesis of Siskind et al (2007) that the raised stratopause of Arctic winter 2006 was due to anomalously low GW activity. Comparing our results with