Download

1 / 15
150 likes | 312 Views
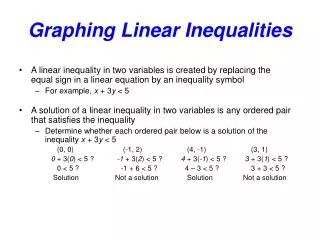
3.3 Systems of Linear Inequalities -graphing -linear programming. Solution. The solution to a system of inequalities is the area where the shaded regions overlap. Any point in this area will work for BOTH of the inequalities. To Graph a Linear Inequality: To To Graph a Linear Inequality:

E N D
3.3 Systems of Linear Inequalities-graphing-linear programming
Solution The solution to a system of inequalities is the area where the shaded regions overlap. Any point in this area will work for BOTH of the inequalities.
To Graph a Linear Inequality: • ToTo Graph a Linear Inequality: • Solve the inequality for y • *Remember: if dividing or multiplying by a negative to switch the sign • Graph the line • * Plot the y-intercept then use • the slope to find the next point • * Dotted line for < and > • * Solid line for < and > • 3) Pick a point not on the line • 4) Plug the point into the inequality • *True = shade the side with the point • *False = shade the other side of the line • Graph a Linear Inequality: • Solve the inequality for y • *Remember: if dividing or multiplying by a negative to switch the sign • Graph the line • * Plot the y-intercept then use • the slope to find the next point • * Dotted line for < and > • * Solid line for < and > • 3) Pick a point not on the line • 4) Plug the point into the inequality • *True = shade the side with the point • *False = shade the other side of the line • Solve the inequality for y • *Remember: if dividing or multiplying by a negative to switch the sign • Graph the line • * Plot the y-intercept then use • the slope to find the next point • * Dotted line for < and > • * Solid line for < and > • 3) Pick a point not on the line • 4) Plug the point into the inequality • *True = shade the side with the point • *False = shade the other side of the line
Graph the system y < -2x + 4 x > -3
Graph the system y < 3x – 6 y > -4x + 2
Graph the system -2y < 4x + 2 y > x + 2 y < 4
Linear Programming -Used to find the maximum or minimum value of an objective function. -The maximum or minimum must occur at a vertex of the feasible region. -Find the feasible region by graphing all constraints. The feasible region is found where all of the shading overlaps. -Determine the coordinates of the vertices of the feasible region and plug these into the objective function to find the minimum or maximum value. -Unbounded regions may have no maximum or minimum.
Find the maximum and minimum value of z = 3x + 4y subject to the following constraints:
Linear Programming Problem The available parking area of a parking lot is 600 square meters. A car requires 6 sq. meters of space and a bus requires 30 sq. meters of space. The attendant can handle no more that 60 vehicles. If a car is charged $2.50 to park and a bus is charged $7.50, how many of each should the attendant accept to maximize profit?
Linear Programming Jeff makes 2 types of wood clocks to sell at local stores. It takes him 2 hours to assemble a pine clock, which requires 1 oz. of varnish. It takes 2 hours to assemble an oak clock which takes 4 oz. of varnish. Jeff has 16 oz. of varnish and he can work 20 hours. He makes a $3 profit on pine clocks and a $4 profit on oak clocks. How many of each type should he make to maximize profit?
Linda makes pumpkin bread and banana bread to sell at a bazaar. A loaf of pumpkin bread requires 2 cups of flour and 2 eggs. A loaf of banana bread takes 3 cups of flour and 1 egg. Linda has 12 cups of flour and 8 eggs. She makes a $2 profit per loaf of pumpkin bread and $2 profit per loaf of banana bread. How many loaves of each should she make to maximize profit?
A biologist needs at least 40 fish for her experiment. She cannot use more than 25 perch or more than 30 bass. Each perch costs $5 and each bass costs $3. How many of each type of fish should she use in order to minimize her cost?
Step by step! -Identify your variables -organize your information (charts help!) -write your objective function -write all constraints -graph all constraints -determine the vertices of the feasible region -plug the coordinates of the feasible region into the objective function -determine the maximum or minimum value -state your answer
Linear programming! • Your factory makes fruit filled breakfast bars and granola bars. For each case of breakfast bars you make $40 profit. For each case of granola bars you make $55 profit. You have a maximum of 150 machine hours and it takes 6 machine hours for each case of granola bars and 2 machine hours for each case of breakfast bars. You have only 155 hours of labor available and it takes 5 hours to make one case of breakfast bars and 4 hours for a case of granola bars. How many cases of each should you produce to maximize profit?