Download
1 / 37
370 likes | 486 Views
GDP and Its Discontents. Suggested Supplementary Reading. Ebook: Peter Kennedy Macroeconomic Essentials: Understanding Economics in the News. Quantity Aggregates. To understand the macroeconomy, we need to measure it. Chief measure of economy is the level of production

E N D
Suggested Supplementary Reading • Ebook: Peter Kennedy Macroeconomic Essentials: Understanding Economics in the News
Quantity Aggregates • To understand the macroeconomy, we need to measure it. Chief measure of economy is the level of production • We need to combine the many goods produced or consumed in an economy into one measure. + + + + =?
All goods sold in an economy share a common unit of measure: the price at which they are sold. Gross Domestic Product (GDP) Sum up the value of goods • GDP is the sum of the value of new, final goods produced within the domestic borders of an economy. Final goods are goods sold to their end-users
GDP does not include: • Intermediate goods which are sold from one firm to another for immediate transformation into other goods. • financial transactions like buying stocks. • purchases of used goods which have been sold before. • goods produced overseas by domestic firms.
Three Methods for Calculating GDP • Production Method - The value added created in all the sectors of the economy. • Expenditure Method - The sum of the domestic spending on final goods (less domestic demand satisfied by imports). • Income Method – The Wage, Rent, Interest and Profit Income generated by the domestic economy.
Production Method • At the plant level, Value added = Sales + Change in inventories - materials, intermediate inputs and energy costs. • Value added at the firm level is directly taxed in the EU (VAT) • GDP is the sum of VA across establishments. • The value of a final good is equal to the value added at each stage of production.
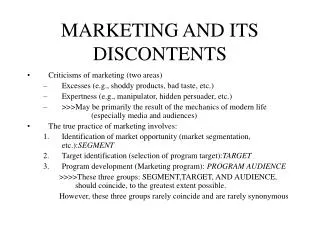
Expenditure Categories in Hong Kong: 2008 Hong Kong Census and Statistics
Income Method • Survey domestic residents and calculate their wage income, interest income, rental income plus the income of proprietors of small firms plus the profits & depreciation of the corporate sector. • Subtract net international income flows. • Not calculated for HK on an annual basis.
High Concept Income = Expenditure = Value Added
High Concept • Value of a final good expenditure is equal to value added at each stage of production. (Expenditure = Value Added) • Value Added would be paid to workers, creditors, or kept as profits. (Income = Value Added)
Compare Macau and the Philippines GDP or GNP • Macau produces a lot of profits paid to overseas owners of casinos. • Philippines workers earn a lot of income overseas. • Which is larger Philippines’ GDP or Philippines GNP? • Does Macau have greater GDP or GNP?
Comparing GDP levels across time • GDP measures the value of the goods produced by an economy by using the market price of each good to assign it a value. • Problem: Prices of goods in terms of money are changing overtime making comparisons in overall value difficult. • Bias: Money prices are growing over time as money supply grows. • Solution: Choose a Base Year’s prices as a fixed yardstick of value for different goods.
Real GDP: Yt • GDP aka Nominal GDP aka Current Dollar GDP is the weighted sum of the number of goods produced using their current prices as the weight. • Real GDP aka Constant Dollar GDP aka GDP adjusted for inflation is the weighted sum of the number of goods produces using the Base Year prices as yardsticks.
Real GDP: Yt • GDP aka Nominal GDP aka Current Dollar GDP is the weighted sum of the number of goods produced using their current prices as the weight. • Real GDP aka Constant Dollar GDP aka GDP adjusted for inflation is the weighted sum of the number of goods produces using the Base Year prices as yardsticks.
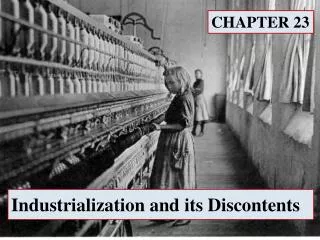
Real GDP vs. Nominal GDP St. Louis Federal Reserve
Real GDP vs. Nominal GDP St. Louis Federal Reserve
Comparing GDP across Countries • When you compare income in two different countries, each country’s GDP per capita is measured in local currency. You need to measure both with common yardstick to compare. • Typically, the common yardstick will be US$. GDP can be converted to US$ by Exchange Rate Method (divide national GDP by the exchange rate) or PPP Method (divide national GDP by PPP).
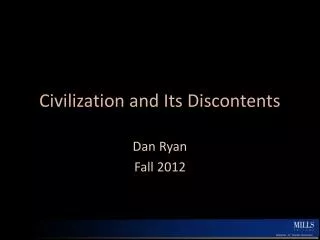
PPP vs. Exchange Rate Conversion • Exchange rates are easily available so exchange rate is a “quick and dirty” comparison. • Measures how many US dollars someone could buy with average income. • However, money goes farther in some countries as many types of goods are relatively cheap (especially developing countries). • PPP conversion measures how much the goods purchased by the average person would cost in the US. Better measure of living standards. World Bank Conversion Factors
Price Indices: Pt • Two most commonly used price indices are GDP Deflator and Consumer Price Index (CPI) • The GDP deflator is the ratio of nominal GDP to Real GDP (multiplied by 100).
Consumer Price Index • The CPI is the price of a representative market basket of goods relative to the price of that same basket during a benchmark/base year (multiplied by 100).
International Comparisons Project • Researchers at U. of Pennsylvania periodically choose a representative world market basket and go to different countries to collect prices of that market basket of good. • For a country, we calculate PPP = Purchasing Power Parity as the price of the market basket relative to price of the market basket in US. • For any country, the exchange rate, St, is the number of domestic dollars per US$. Penn World Tables
Depreciation • Part of the Investment that is being done will only go to replacing depreciated capital. • When Hurricane Katrina hits, repair of infrastructure counts as GDP even though that only replaces what is lost. • Net DP • Conceivably, since only consumer spending generates benefit to household welfare, maybe consumption itself is a better measure.
National Resource Depletion • Selling of mineral extraction and other non-renewable resources increases income but this also runs down wealth. • Example: Nauru and Phosphates https://www.cia.gov/library/publications/the-world-factbook/geos/nr.html
Environmental Quality • Clean air and water are important for welfare but not measurable as a market good (ie. GDP is a market good). • Possible Solution: Estimate of environmental quality.
Inputed Services of Non-Market Capital • Welfare generated by renting housing included in GDP, but what if you own your own home? • Statistical agencies include imputed value of homes by checking rental rates but not cars, TV’s etc. • Is rental market parallel to purchase market?
Housework • If you pay someone to do housework or watch your kids, then it will be counted in GDP. If you do it yourself, it will not be. • Big shift from household production to market production of housing services in recent years (helpers, daycare, kindergarten, tutors, etc.) • This shift would increase GDP without more goods being produced.
Income Distribution • GDP per Capita is a measure of the income for the average person • But if one person has $1,000,000 and another person has 0, the average is $500,000. • This is a quite different economy than one in which two people both have $500,000.
Health/Crime • Life expectancy and infant mortality are key indicators of living standard.