Download

1 / 30
300 likes | 304 Views
This outline provides a brief overview of past studies and trends in world migration from 1990 to 2011, including push and pull factors, key migration periods, literature reviews, and modern US internal migration. It highlights the increasing connections between countries, the application of the gravity model, and the impact of common language, religion, and economic power on migration patterns.

E N D
Us Migration From 1990 to 2011 By Travis Goldade
OUTLINE • Brief Overview • Past Studies • World • US • Small discussion my plan
Overview • Common field • Economics, Demography, Resource Management… • Many models yet many not widely accepted Most Widely accepted Economical • Push & Pull Factors • Push Political instability, War, Famine • Pull Economics, Population, Cultural, Sociological
World Migration From the start All of Africa was populated by 150 thousand Yrs
World Migration From the start Moved in Mid East 100 thousand Yrs
World Migration From the start Settled Europe 40 thousand Yrs
World Migration From the start Bearing Land Crossing ~20 thousand Yrs
World Migration From the start Polynesia wasn’t settled till ~1000 A.D. Reason For Migration: Survival • Invasions • Famine • Climate Change
World Migration Age of Exploration ~1600 to 1800 First major Migration of people for social needs (Printing Press) Reason For Migration: Freedom • Religious persecution • Nationalism • Slave Trade
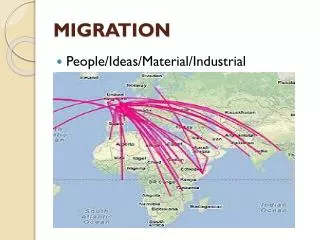
World Migration Industrial/Modern Migration ~1800 to Today Better Transportation (steam engine) Reason For Migration: Money & War • Labor Migration (international) • Refugees (political & warfare) • Urbanization (Internal)
World Migration Trends It is Accelerating Migration Follows Change More people are moving • Climatic, Resource Based • People had to move to live • Renascence Social Revolution • Moved for Freedom • Industrial Revolution • Moved for Money • Political Shocks (fall of USSR) 16th -18th century 200 thousand people moved to America 19th century over 50 Million people moved to America People move more for Economic reasons today Product of Globilzation
World Migration Literature • Key Difference • Use of Network Metrics • i.e. distance, GDP, Linguistic & Social Ties • One used them independently • Other combined metrics Two Studies with Complex Network Studied from 1960 – 2000 Used Global Migration Data Base (GMD) Not at all a complete data set only tracks citizen changes • Both • Studied from 1960 – 2000 • Treated countries As Nodes • Links = number of migrants Both had very similar results
World Migration Literature Combined Results Increasing Connections • 1960 - 47% of countries were connected • 2000 - 62% of the countries were connected Decrease in Path Length & Increase Clustering Coeff • 1960 - length .66 CC .74 • 2000 – length . 62 CC .76
World Migration Literature Combined Results Random non assortative Network Increasing Connections • 1960 - 47% of countries were connected • 2000 - 62% of the countries were connected • There were hubs (US, Germany ect) • Geographic distances limited direct routs • Graph of nearest neighbors degree • Suggests a random network Decrease in Path Length & Increase Clustering Coeff Gravity Model Applied • 1960 - length .66 CC .74 • 2000 – length . 62 CC .76 • F= flow • G= const • D= Distance • M=Economic Mass
World Migration Literature Combined Results • Power Law Applies • K= undirected connections btw neighbors (cluster) • S = Weight of Link Random non assortative Network • There were hubs (US, Germany ect) • Geographic distances limited direct routs • Graph of nearest neighbors degree • Suggests a random network Gravity Model Applied • F= flow • G= const • D= Distance • M=Economic Mass
World Migration Literature • Things effecting mutual migration • + = Common Language • = Common Religion • x= population
World Migration Literature • The second study was very similar • Only real difference is they combined multiple metrics • Language, Religion, Economic power ect • They combined these in a 5 point metric • Referenced in a book I could not access Log(N) =1.36 in 2000 Log(N) =3.38 in 2000
World Migration Literature • Small world behavior is being observed (globalization) • Over time Larger Communities • Less of them • Result of Migrations corridors combining • NOT geographically bound • Smaller degree countries are becoming more connected Conclusions Strongly Connected Graph • 1960 – Only Taiwan and Belize had no immigrants • 2000 – Every county is has immigrants People are moving directly to migration sinks • The migration paths are creating links, & becoming more direct • Most common is North to North & South to South migrations • South to North is becoming more common • Eating into South to South • Hubs include • Germany, USA, England
Modern US Migration Not vey well studied Trends Influx migration strong indicator of healthy economy Good Economic times Ordered people go where the jobs are Flow from East to West • Economic & Social based • People move for leisure • Educated young males most likely Bad Economic times Chaotic • Pull Factors • High Employment • Larger Populations (Urbanization) • Housing • Push Factors • High Taxes • Crime • Unemployment…
Modern US MigrationLiterature Very little has been done Majority are Economic Studies Summery of Results • Nothing has been done for Complex Network analyses • Majority are study of population increase/decrease • Not looking where they are going • 90’s 2007 Net out flow of people to the sunbelt seeking cheaper homes • Pop is more mobile during good times & stagnate during recessions • Largest Pulling factors were Housing & Economic factors • Practically Nothing about where people go during economic hardship • Population inflow is a strong economic indicator, however outflow is not a weak one • Important is % net flux in • Only major Pushing factor was Tax rates (government)
My Proposal I will be tracing the migration of people from county to county With data from IRS Migration data • They have records of where people are moving from each county from 1990 -2011 • I would like to see if any patterns arise • In particular I would like to see if there relationship btw net migration and political affiliation during different times • This data might not be straight forward
Summation Complex Analysis has rarely been applied to migration • US Scale • People move for leisure • Typically follow housing prices & job opportunities • Poorly understood • People tend to follow money • Strong Economic Indicator • Historically people move following change & Survival • World Scale • People are moving to Economic Hubs • They move more out of Necessity • I propose • Map county by county map of the US from 1990 to 2011 • Look for patterns • Particularly Political Patterns